Community Info October 11, 2018

South King County Quarterly Market Trends

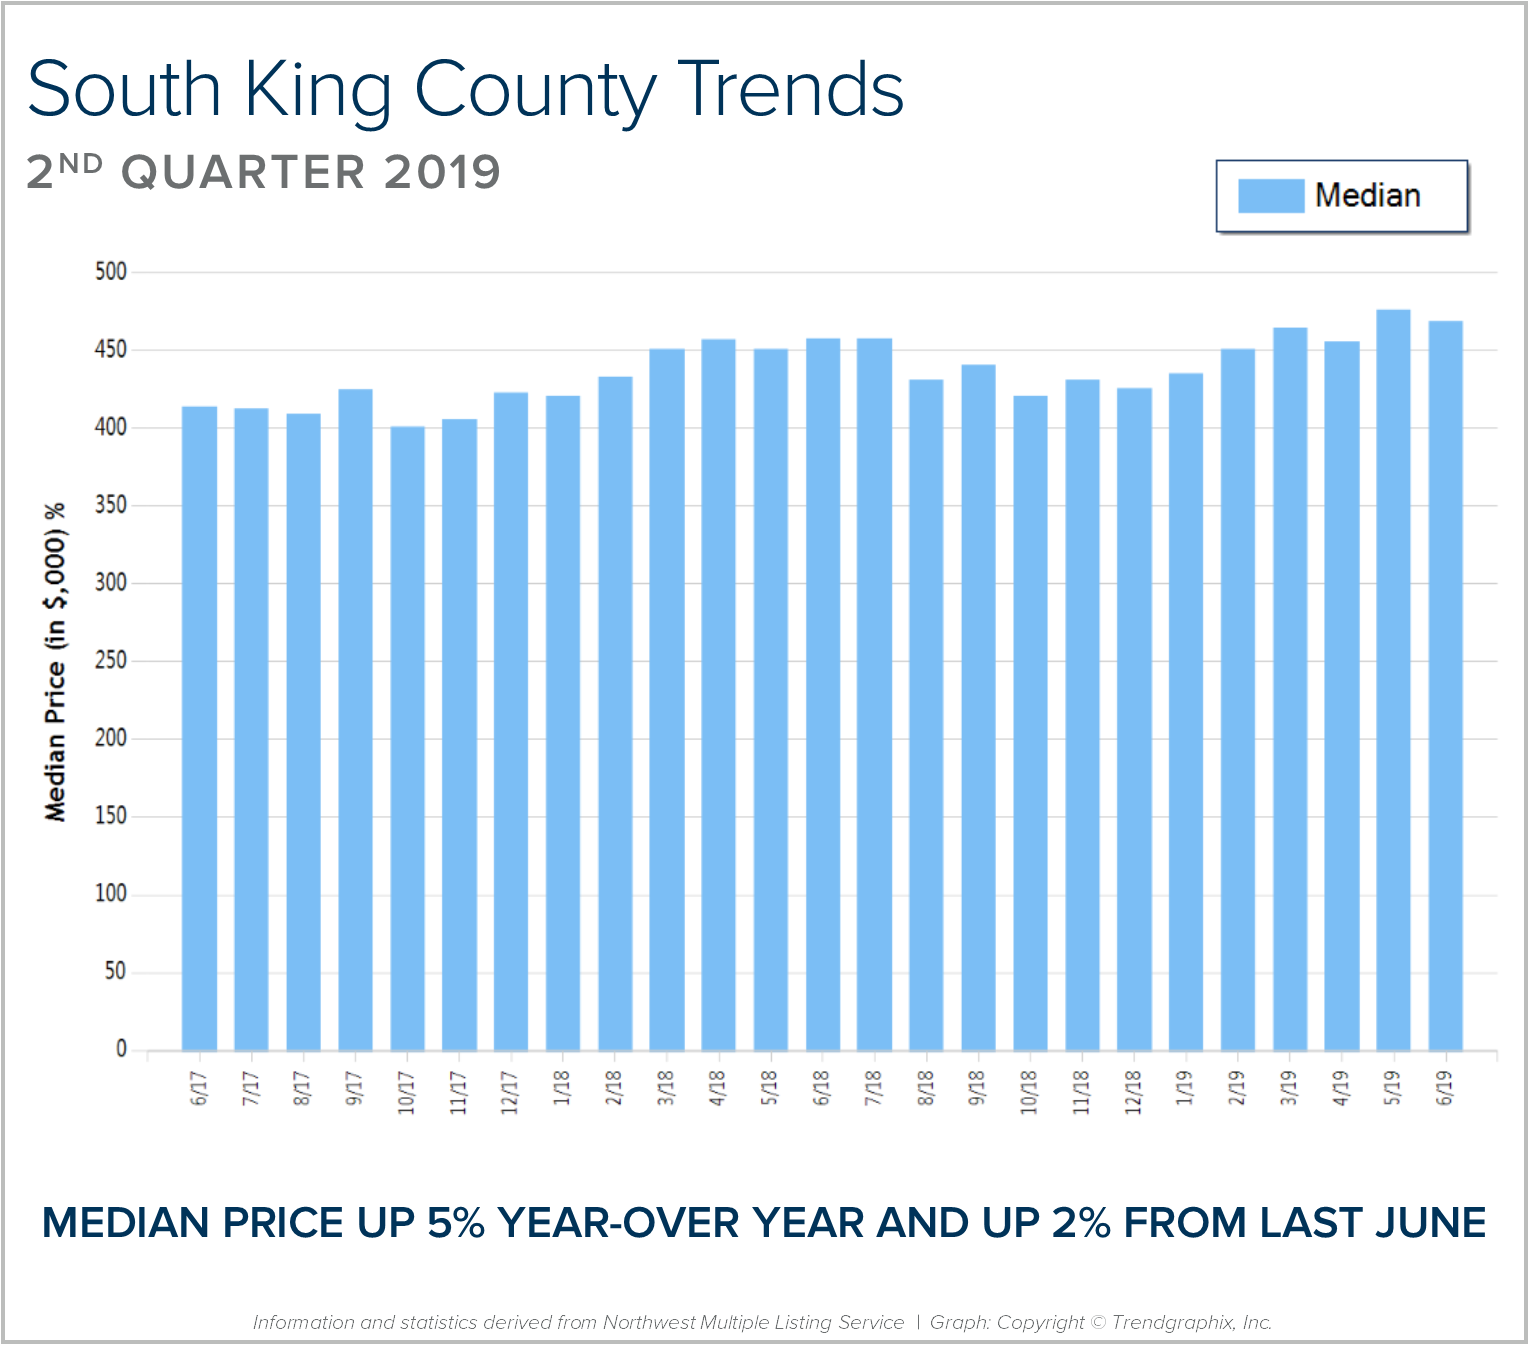
In September, the average days on market landed at 26 days and the original list-to-sale price ratio 98%. Since May, inventory growth has been noticeable, and has given buyers more options. This has led to more negotiations and fewer bidding wars, which is tempering month-over-month price growth to a more sustainable level. Back in April, the average days on market was 21 days and the original list-to-sale price ratio 103%; but months of inventory based on pending sales was 0.9 months, compared to 2.6 months currently. Year-over-year, prices are up 10%, still well above the historical norm of 3%-5% year-over-year gains—but note that the majority of this growth happened during the spring, due to constricted inventory levels.

Supply has increased, creating more options for buyers and helping to buffer affordability issues. Many sellers are deciding to make moves and cash in on the equity gained over the last six years. An average original list-to-sale price ratio of 98% is a positive return, yet illustrates a softening in the market after some very extreme times. With 10% price growth over the last 12-months in a seller’s favor, the increase in selection has led to more nimble moves from one house to another. Where sellers need to be careful is anticipating the month-over-month price growth we saw prior to the shift in inventory. Prospective buyers would be smart to take advantage of today’s historically low interest rates and the added inventory selection.

This is only a snapshot of the trends in south King County; please contact me if you would like further explanation of how the latest trends relate to you.

Community Info October 11, 2018

North Snohomish County Quarterly Market Trends

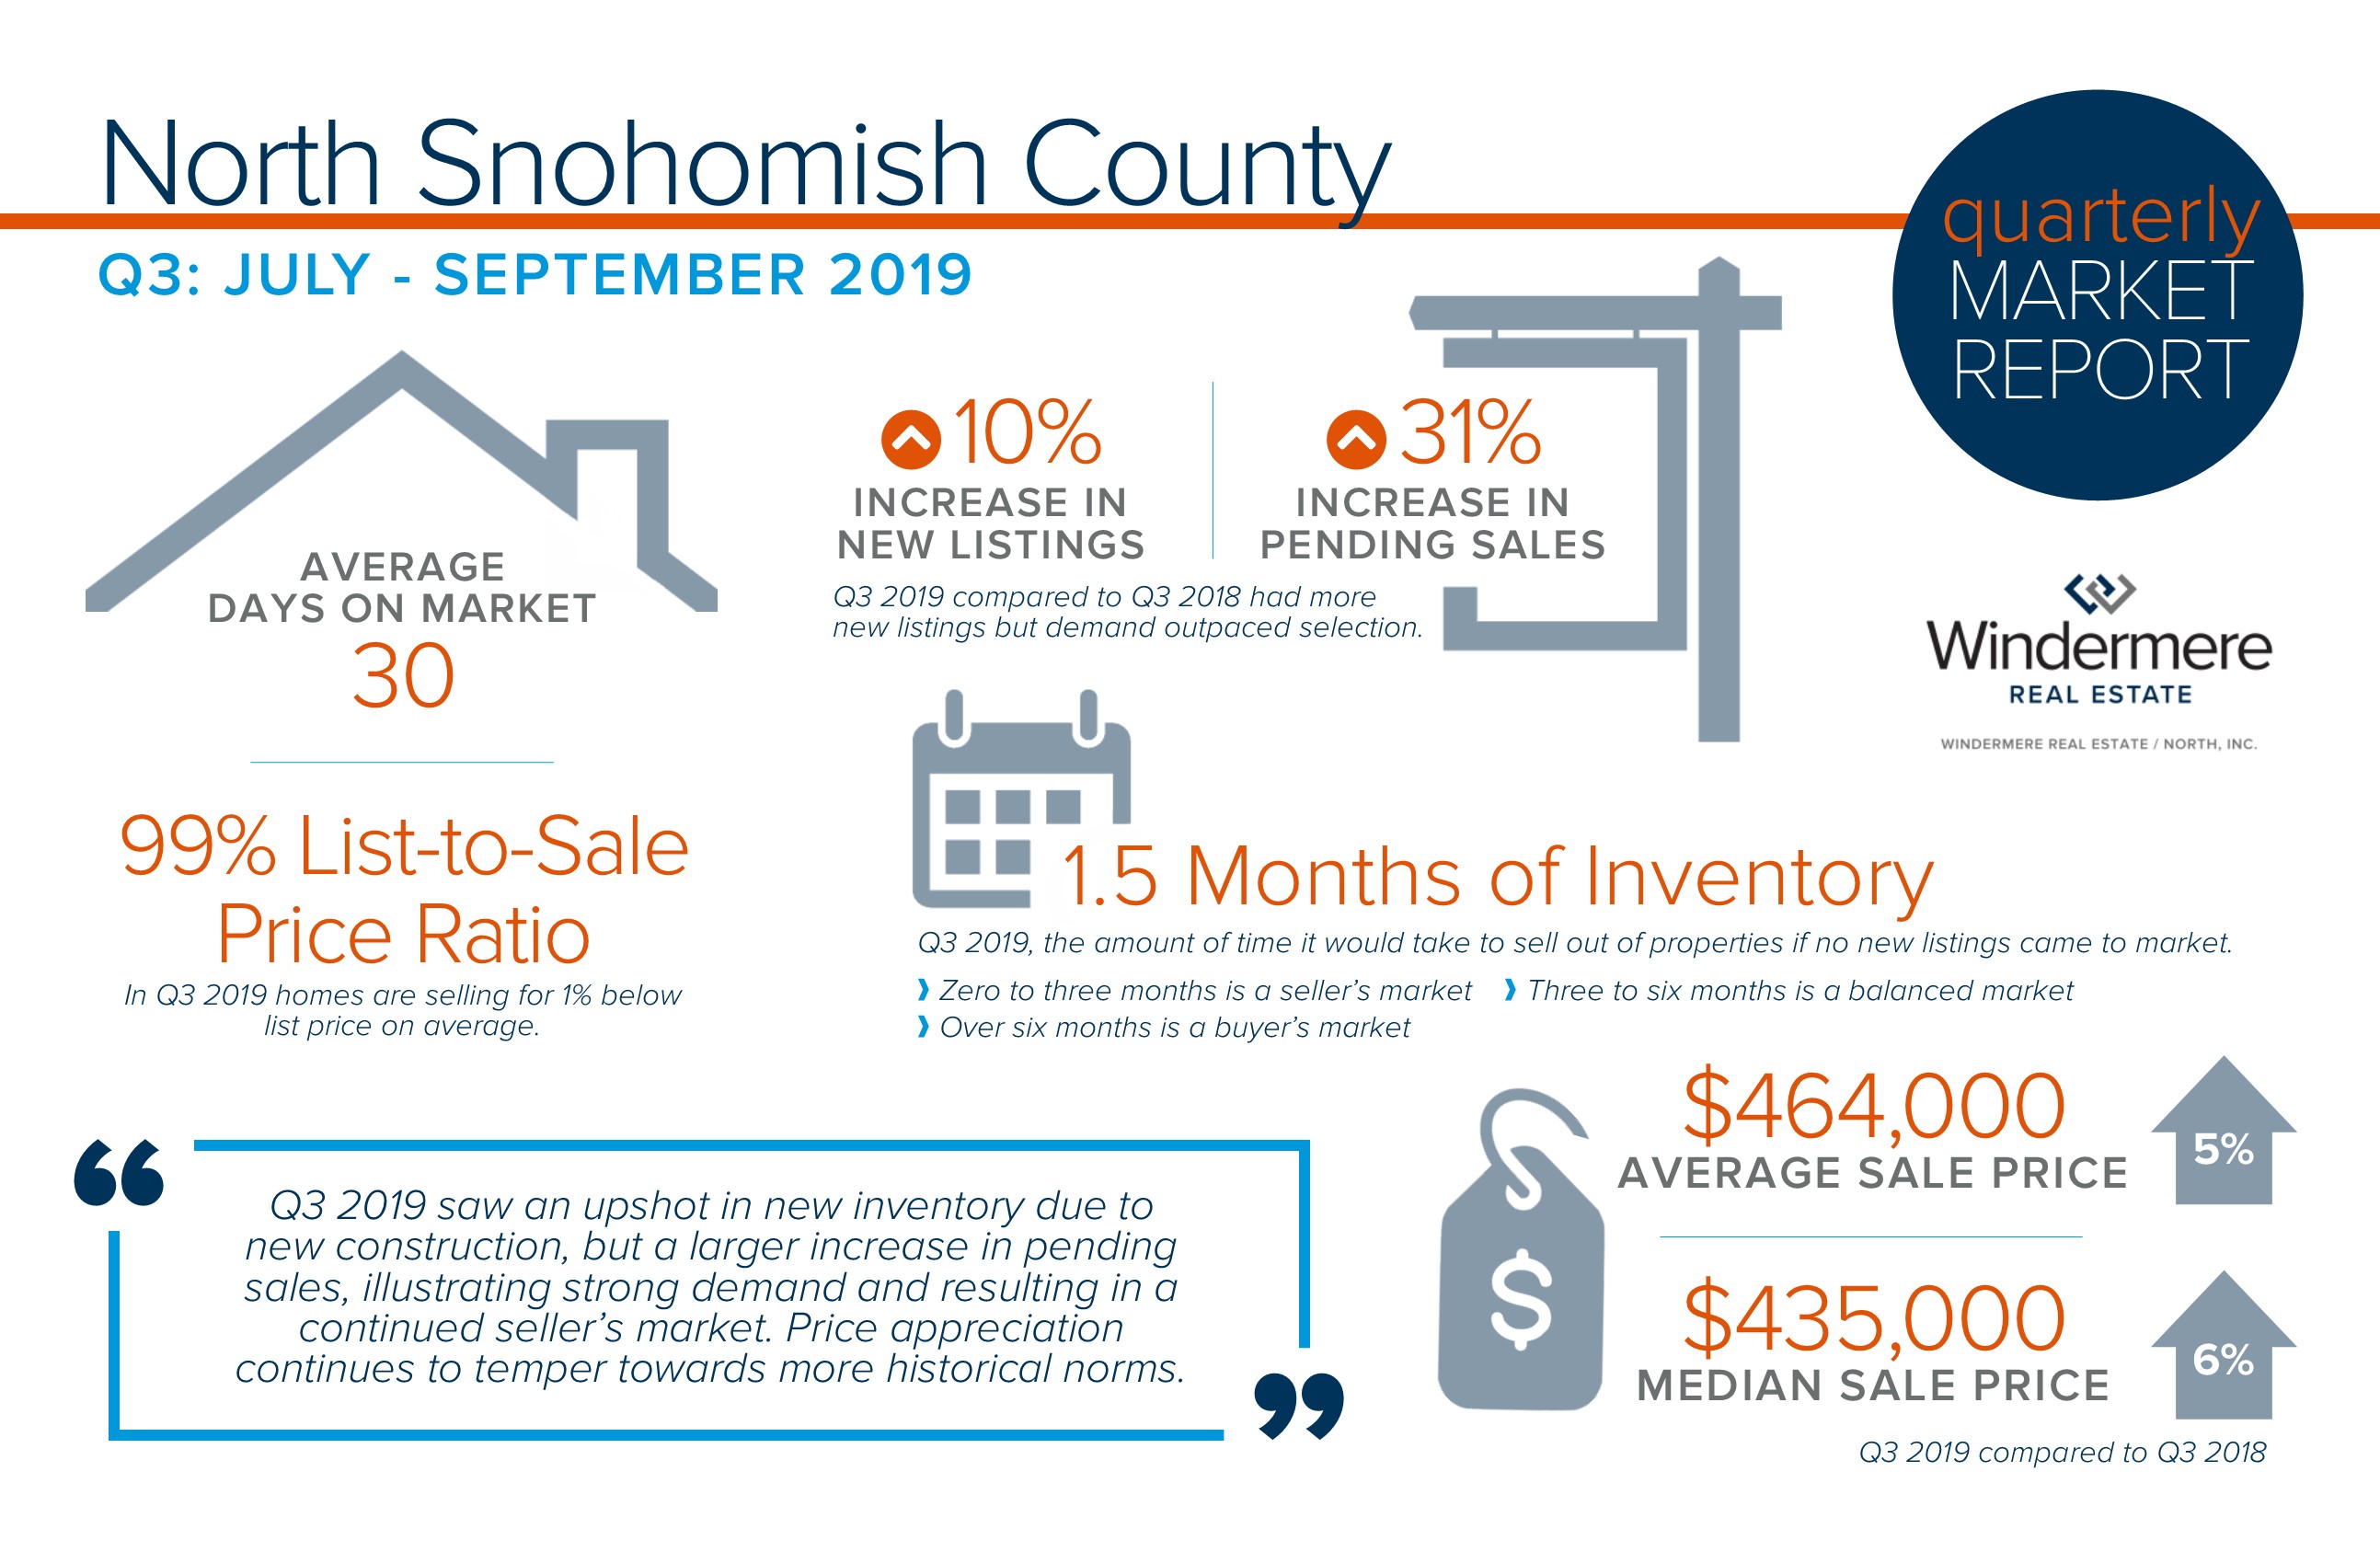
In September, the average days on market landed at 29 days and the original list-to-sale price ratio at 98%. Since May, inventory growth has been noticeable, and has given buyers more options. This has led to more negotiations and fewer bidding wars, which is tempering month-over-month price growth to a more sustainable level. Back in May, the average days on market was 22 days and the original list-to-sale price ratio 101%; but months of inventory based on pending sales was 1 month compared to 2.3 months currently. Year-over-year, prices are up 11%, still well above the historical norm of 3%-5% year-over-year gains—but note that the majority of this growth happened during the spring, due to constricted inventory levels.

Supply has increased, creating more options for buyers and helping to buffer affordability issues. Many sellers are deciding to make moves and cash in on the equity gained over the last six years. An average original list-to-sale price ratio of 98% is a positive return, yet illustrates a softening in the market after some very extreme times. With 11% price growth over the last 12-months in a seller’s favor, the increase in selection has led to more nimble moves from one house to another. Where sellers need to be careful is anticipating the month-over-month price growth we saw prior to the shift in inventory. Prospective buyers would be smart to take advantage of today’s historically low interest rates and the added inventory selection.

This is only a snapshot of the trends in north Snohomish County; please contact me if you would like further explanation of how the latest trends relate to you.

Community Info October 11, 2018

Seattle Metro Quarterly Market Trends

In September, the average days on market landed at 23 days and the original list-to-sale price ratio 98%. Since May, inventory growth has been noticeable, and has given buyers more options. This has led to more negotiations and fewer bidding wars, which is tempering month-over-month price growth to a more sustainable level. Back in April, the average days on market was 11 days and the original list-to-sale price ratio 105%; but months of inventory based on pending sales was 0.8 months, compared to 2.4 months currently. Year-over-year, prices are up 11%, still well above the historical norm of 3%-5% year-over-year gains—but note that the majority of this growth happened during the spring, due to constricted inventory levels.

Supply has increased, creating more options for buyers and helping to buffer affordability issues. Many sellers are deciding to make moves and cash in on the equity gained over the last six years. An average original list-to-sale price ratio of 98% is a positive return, yet illustrates a softening in the market after some very extreme times. With 10% price growth over the last 12-months in a seller’s favor, the increase in selection has led to more nimble moves from one house to another. Where sellers need to be careful is anticipating the month-over-month price growth we saw prior to the shift in inventory. Prospective buyers would be smart to take advantage of today’s historically low interest rates and the added inventory selection.

This is only a snapshot of the trends in the Seattle Metro area; please contact me if you would like further explanation of how the latest trends relate to you.

Community Info October 11, 2018

Eastside Quarterly Market Trends

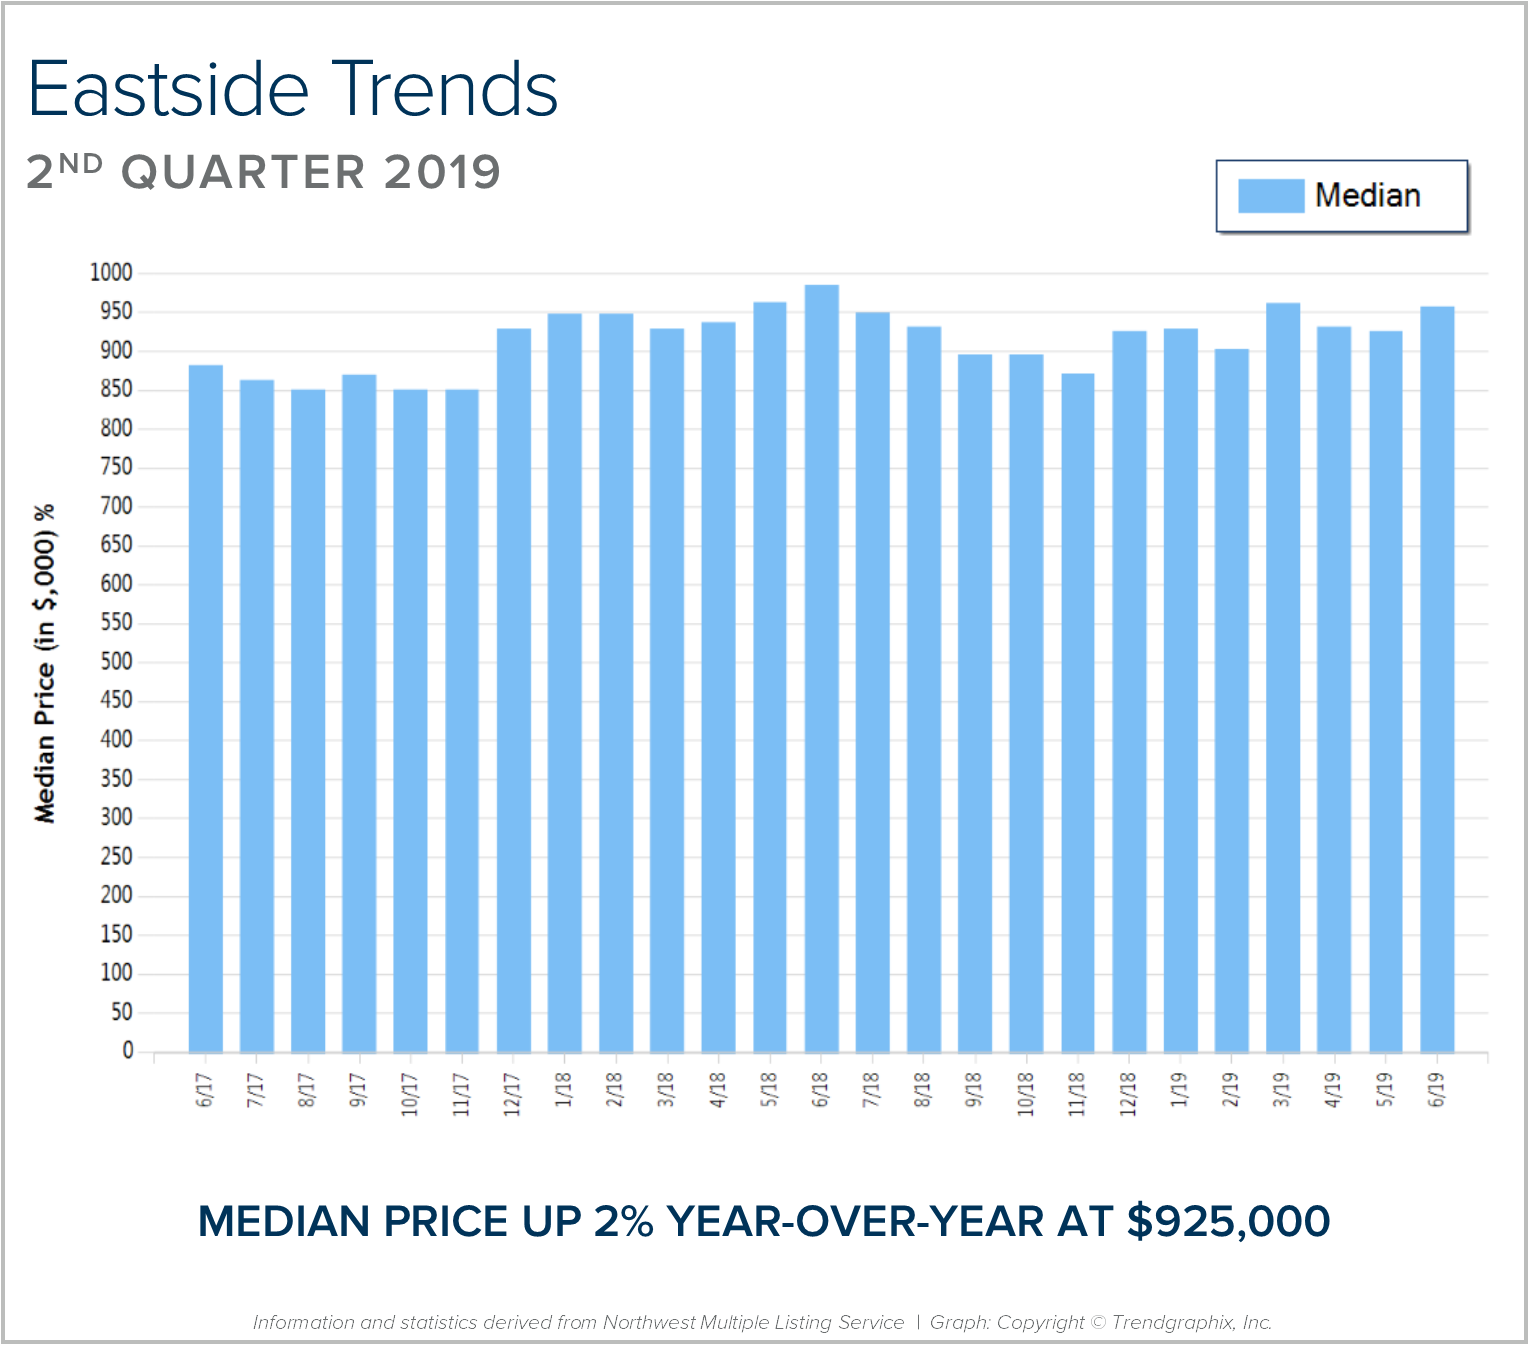
In September, the average days on market landed at 32 days and the original list-to-sale price ratio 98%. Since May, inventory growth has been noticeable, and has given buyers more options. This has led to more negotiations and fewer bidding wars, which is tempering month-over-month price growth to a more sustainable level. Back in April, the average days on market was 13 days and the original list-to-sale price ratio 103%; but months of inventory based on pending sales was 0.8 months, compared to 2.9 months currently. Year-over-year, prices are up 10%, still well above the historical norm of 3%-5% year-over-year gains—but note that the majority of this growth happened during the spring, due to constricted inventory levels.

Supply has increased, creating more options for buyers and helping to buffer affordability issues. Many sellers are deciding to make moves and cash in on the equity gained over the last six years. An average original list-to-sale price ratio of 98% is a positive return, yet illustrates a softening in the market after some very extreme times. With 10% price growth over the last 12-months in a seller’s favor, the increase in selection has led to more nimble moves from one house to another. Where sellers need to be careful is anticipating the month-over-month price growth we saw prior to the shift in inventory. Prospective buyers would be smart to take advantage of today’s historically low interest rates and the added inventory selection.

This is only a snapshot of the trends on the Eastside; please contact me if you would like further explanation of how the latest trends relate to you.

Community Info October 11, 2018

North King County Quarterly Market Trends

In September, the average days on market landed at 23 days and the original list-to-sale price ratio 98%. Since May, inventory growth has been noticeable, and has given buyers more options. This has led to more negotiations and fewer bidding wars, which is tempering month-over-month price growth to a more sustainable level. Back in April, the average days on market was 12 days and the original list-to-sale price ratio 106%; but months of inventory based on pending sales was 0.8 months, compared to 2.2 months currently. Year-over-year, prices are up 10%, still well above the historical norm of 3%-5% year-over-year gains—but note that the majority of this growth happened during the spring, due to constricted inventory levels.

Supply has increased, creating more options for buyers and helping to buffer affordability issues. Many sellers are deciding to make moves and cash in on the equity gained over the last six years. An average original list-to-sale price ratio of 98% is a positive return, yet illustrates a softening in the market after some very extreme times. With 10% price growth over the last 12-months in a seller’s favor, the increase in selection has led to more nimble moves from one house to another. Where sellers need to be careful is anticipating the month-over-month price growth we saw prior to the shift in inventory. Prospective buyers would be smart to take advantage of today’s historically low interest rates and the added inventory selection.

This is only a snapshot of the trends in north King County; please contact me if you would like further explanation of how the latest trends relate to you.

Community Info October 11, 2018

South Snohomish County Quarterly Market Trends

In September, the average days on market landed at 27 days and the original list-to-sale price ratio 98%. Since May, inventory growth has been noticeable, and has given buyers more options. This has led to more negotiations and fewer bidding wars, which is tempering month-over-month price growth to a more sustainable level. Back in April, the average days on market was 14 days and the original list-to-sale price ratio 104%; but months of inventory based on pending sales was 0.8 months, compared to 2.5 months currently. Year-over-year, prices are up 11%, still well above the historical norm of 3%-5% year-over-year gains—but note that the majority of this growth happened during the spring, due to constricted inventory levels.

Supply has increased, creating more options for buyers and helping to buffer affordability issues. Many sellers are deciding to make moves and cash in on the equity gained over the last six years. An average original list-to-sale price ratio of 98% is a positive return, yet illustrates a softening in the market after some very extreme times. With 11% price growth over the last 12-months in a seller’s favor, the increase in selection has led to more nimble moves from one house to another. Where sellers need to be careful is anticipating the month-over-month price growth we saw prior to the shift in inventory. Prospective buyers would be smart to take advantage of today’s historically low interest rates and the added inventory selection.

This is only a snapshot of the trends in south Snohomish County; please contact me if you would like further explanation of how the latest trends relate to you.

Monthly Newletter September 30, 2018

Monthly Newsletter

With the sharpest increase of available homes for sale in years, more opportunities are now available for buyers, including first-timers. Many first-time home buyers have sat on the sidelines and remained renters due to the constriction of inventory, which put major pressure on price affordability. Not only has affordability been an issue, but the terms required to prevail in a multiple-offer situation were often not within reach for someone entering the market for the first time.

For example, over the last 12 months in the Seattle Metro area we have seen a 66% increase in the selection homes for buyers to choose from. There is currently 1.8 months of available inventory based on pending sales versus 0.8 months that was available the same month last year. This is still a seller’s market (0-3 months), but it is providing more than twice as much selection than a year ago. This loosening up of the market has helped to temper price growth by reducing the amount of price escalations and the need to have super aggressive financing terms in order to secure a home.

You see, over the last 3-4 years we have experienced double-digit price appreciation (10-14%) year-over-year, each year. A normal rate of appreciation is 3-5%. Minimal amounts of available inventory, low interest rates, and rapid job growth led to this increase in prices. Now that more homes are coming to market and job growth has stabilized a bit (still growing, but not as fast), price growth has slowed. This is good news for sustainability and affordability. Here’s the deal though – we are still experiencing growth in values, making home ownership a sound investment over renting.

According to the most recent survey from rentcafe.com, the average rent for an apartment in Seattle is $1,906 with an average square footage of 736 sq. ft. That is quite a bit of money for not a ton of space. Further, that monthly expenditure does not create any wealth for the renter, only for the landlord. With renting, rates can be increased at any time, and you are paying down someone else’s asset, not your own. Also, owning gives the homeowner control of their overhead, while getting to make their house their home by adding improvements such as painting.

There are several factors to consider that will lead a person to make the best decision for their lifestyle and their financial bottom line. One of the biggest factors is interest rates! Currently, the rate for a 30-year fixed, conventional, conforming loan is hovering around 4.88%. Up from earlier this year and predicted to rise, but still historically low over the course of the last 30 years. These rates need to be considered the greatest opportunity of them all! With prices tempering and rates still under the 30-year average of 6.65%, buyers are able to secure a sound investment with very low debt service.

With interest rates predicted to rise over the next year, a good rule of thumb to remember is that for every one-point increase in rate, a buyer loses 10% of their buying power. For example, if the rate jumps from 4.75% to 5.75% and one wants to keep the same monthly payment, they must adjust their price point down by 10%. So, a $450,000 budget becomes a $405,000 budget, and that isn’t taking appreciation into consideration. If you assume an average appreciation rate of 4% year-over-year, today’s $450,000 house will be $468,000 next year. What side of the equity growth do you want to be on? As an owner now, or a buyer a year from now, when prices are higher and interest rates are most likely higher as well?

Once you secure a mortgage, the payment stays the same over the term of the entire loan. The long-term benefits of owning are abundant, including the stability of not being asked to move. These are important factors to consider for everyone, but especially millennials, who are enjoying the benefits of Seattle’s attractive job market. One myth to address is the common belief that you must have a 20% down payment in order to buy a home. That is simply not true. There are loan programs as low as 3% down, decreasing the need to have a large sum of money saved up before being able to buy.

Where folks are having to compromise the most due to affordability is commute times, and settling in less-urban neighborhoods. Worth pointing out, is the average home price in south Snohomish County is 34% less than Seattle Metro – that is a huge savings! Further, south King County is 74% more affordable than Seattle. Some people, mainly millennials, have not been willing to give up living in the core urban neighborhoods that have high walk scores and shorter commute times. That should be apt to change with more selection available in the purchase market, coupled with low interest rates. The advantages of moving out a little further and securing a home will start people on the track of building long-term wealth. If you or anyone you know is currently renting and is considering a change, please let me know, as I would be happy to get their questions answered and help them make an informed decision.

Don’t Wait for a Disaster to Build Your Emergency Kit
Two Weeks Ready: Be Prepared. Build Kits. Help Each Other.

The first few days after a disaster are often the most critical. Government and essential services may not be available right away, depending on the circumstances. It is imperative to have a plan in place for such a time, and be ready to act on your own.

Washington’s biggest disaster threat is from earthquakes. Washington State’s Emergency Management Division advises that we take precautions to be on our own for at least 2 weeks. Take a look at their Two Week Ready Brochure (PDF) that outlines the basics necessary for your emergency kit. While it is important to get ready, don’t feel like you have to do it all at once. The list of necessities is long, so take a look at the agency’s year-long prep plan. You will also find information on pet preparedness, as well as the agency’s Drop, Cover, and Hold Earthquake Scenario map.

#TackleHomelessness Update

During last weekend’s win against Dallas, the Seattle Seahawks had 46 defensive tackles, raising another $4,600 for Windermere’s #TackleHomelessness campaign. Combined with what we’ve raised over the past two seasons, this brings our to-date grand total to $71,400! All season long we’ll be partnering with the Seahawks to raise money for YouthCare in support of homeless youth.

Community Info August 30, 2018

Pumpkin Patch Guide 2018

Nothing feels more like fall than pumpkin picking, hay rides and corn mazes. Get your latte in hand and head out to any one of these great, local farms to have some harvest fun and find that perfect jack-o-lantern to light up your porch.

Times, dates & activities may change, please use the links provided for details.


KING COUNTY

Baxter Barn
31929 SE 44th St, Fall City
Pumpkin patch, tractor-pulled hay rides, fresh eggs, gift shop, pony rides, picnic area, farm animals

Carpinito Brothers
1148 Central Ave N, Kent
Pumpkin patch, corn maze, farm fun yard, hay rides, produce stand, concessions

Fall City Farms
3636 Neal Road, Fall City
Pumpkin patch, tractor-pulled hay rides, fresh honey, pre-picked produce, farm animals, snacks and refreshments.

Fox Hollow Family Farm
12031 Issaquah Hobart Rd SE, Issaquah
Pumpkins for sale, hay bale maze, bouncy house, face painting, haunted house, pony rides, petting zoo, farm animals, concessions

Jubilee Farm
229 W Snoqualmie River Rd NE, Carnation
Pumpkins, horse-drawn covered wagon rides, hay rides, hay bale maze

Oxbow Farm
10819 Carnation-Duvall Rd NE, Carnation
Pumpkins, produce, picnic area, playground

Mosby Farm Pumpkin Patch
12747-b South East Green Valley Rd, Auburn
Pumpkin patch, corn maze,  tractor-pulled hay rides, snacks and refreshment stand, picnic area

The Nursery at Mt Si
42328 SE 108th St, North Bend
Pumpkin patch, tractor-pulled hay rides

Remlinger Farms
32610 NE 32nd St, Carnation
Pumpkin patch, corn maze, animal barnyard, pony rides, steam train, hay jump

Serres Farm
20306 NE 50th St, Redmond
Pumpkin patch, corn maze, duck races, animal train

Thomasson Family Farm
38223 236th Ave SE, Enumclaw
Pumpkin patch, corn maze, kids korral, tractor train rides, pumpkin sling shot

Tonnemaker Valley Farm, Woodinville Farm Stand
16215 140th Pl NE, Woodinville
You-pick pumpkin patch, you-pick flowers, produce stand, on-site pepper roasting on Saturdays


SNOHOMISH COUNTY

Biringer’s Black Crow Pumpkins & Corn Maze
2431 Highway 530 NE, Arlington
Pumpkin patch, corn maze, straw or hay bale maze, tractor-pulled hay rides, farm market, picnic area

Bob’s Corn & Pumpkin Farm
10917 Elliott Rd, Snohomish
Pumpkin patch, corn maze, bonfire & picnic area, hay rides, pony rides, playground, concessions

Carleton Farm
630 Sunnyside Blvd SE, Lake Stevens
Pumpkin patch, train rides, corn maze, haunted corn maze, tractor-pulled hay rides, farm animals, farm market

Craven Farm
13817 Short School Rd, Snohomish
Pumpkin patch, corn maze, tractor-pulled hay rides, face painting, farm animals, snacks & refreshment stand

The Farm at Swans Trail
7301 Rivershore Rd, Snohomish
Pumpkin patch, corn maze, pick your own apples, pig & duck races, petting zoo, putt-putt golf and more

Fairbank Animal Farm & Pumpkin Patch
15308 52nd Ave W, Edmonds
Pumpkins, petting zoo, farm animals, picnic area

Fosters Pumpkin Farm
5818 State Route 530 NE, Arlington
Pumpkin patch, corn maze, hay bale maze, corn cannon, pre-picked produce, face painting, farm animals, snacks and refreshment stand, picnic area

Stocker Farms
8705 Marsh Rd, Snohomish
Pumpkin patch, corn maze, haunted corn maze, tractor-pulled hay rides, jumping pillow and more

Thomas Family Farm
9010 Marsh Road, Snohomish
Pumpkin patch, corn maze, monster truck rides, haunted house, gem mining, Zombie Safari Paintball Hayride, beer garden, putt-putt golf and more


PIERCE COUNTY

Double R Farms
5820 44th St E, Puyallup
Pumpkin patch, corn maze, hay rides, farm animals, pumpkin sling shot

Maris Farms
25001 Sumner-Buckley Hwy, Buckley
Pumpkin patch, corn maze, haunted woods, farm animals, hay ride, trout fishing, play ground

Picha’s Farm
6502 52nd St E, Puyallup
Pumpkin patch, corn maze, hay ride, pumpkin sling shot, concessions

Scholz Farm
12920 162nd Ave E, Orting
Pumpkin patch, corn maze, play area

Spooner Farms
9622 SR 162 E, Puyallup
Pumpkin patch, farm animals, face painting, pumpkin sling shot, concessions

Community Info August 30, 2018

Dont Wait for a Disaster to Build Your Emergency Kit

Two Weeks Ready: Be Prepared. Build Kits. Help Each Other.

The first few days after a disaster are often the most critical. Government and essential services may not be available right away, depending on the circumstances. It is imperative to have a plan in place for such a time, and be ready to act on your own.

Washington’s biggest disaster threat is from earthquakes. Washington State’s Emergency Management Division advises that we take precautions to be on our own for at least 2 weeks. Take a look at their Two Week Ready Brochure (PDF) that outlines the basics necessary for your emergency kit. While it is important to get ready, don’t feel like you have to do it all at once. The list of necessities is long, so take a look at the agency’s year-long prep plan. You will also find information on pet preparedness, as well as the agency’s Drop, Cover, and Hold Earthquake Scenario map.

Community Info August 30, 2018

Windermere and the Seahawks are Back for Another Season to #TackleHomelessness!

All of us at Windermere are very excited to kick off our third season as the Official Real Estate Company of the Seattle Seahawks!


Once again, our #tacklehomelessness campaign is front-and-center, with the Windermere Foundation donating $100 for every Seahawks home-game tackle during the 2018 season to YouthCare, a Seattle-based non-profit organization that has been providing services and support to homeless youth for more than 40 years. Over the last two years, the Seahawks helped us raise over $66,000 through our #tacklehomelessness campaign, and this year we are looking forward to raising even more money – and awareness – for this important cause.


Our partnership with the Seahawks and YouthCare fits perfectly with the mission of the Windermere Foundation which is to support low-income and homeless families in the communities where we have offices. Through the #tacklehomelessness campaign, we hope to be able to do even more.