Community Info October 15, 2019

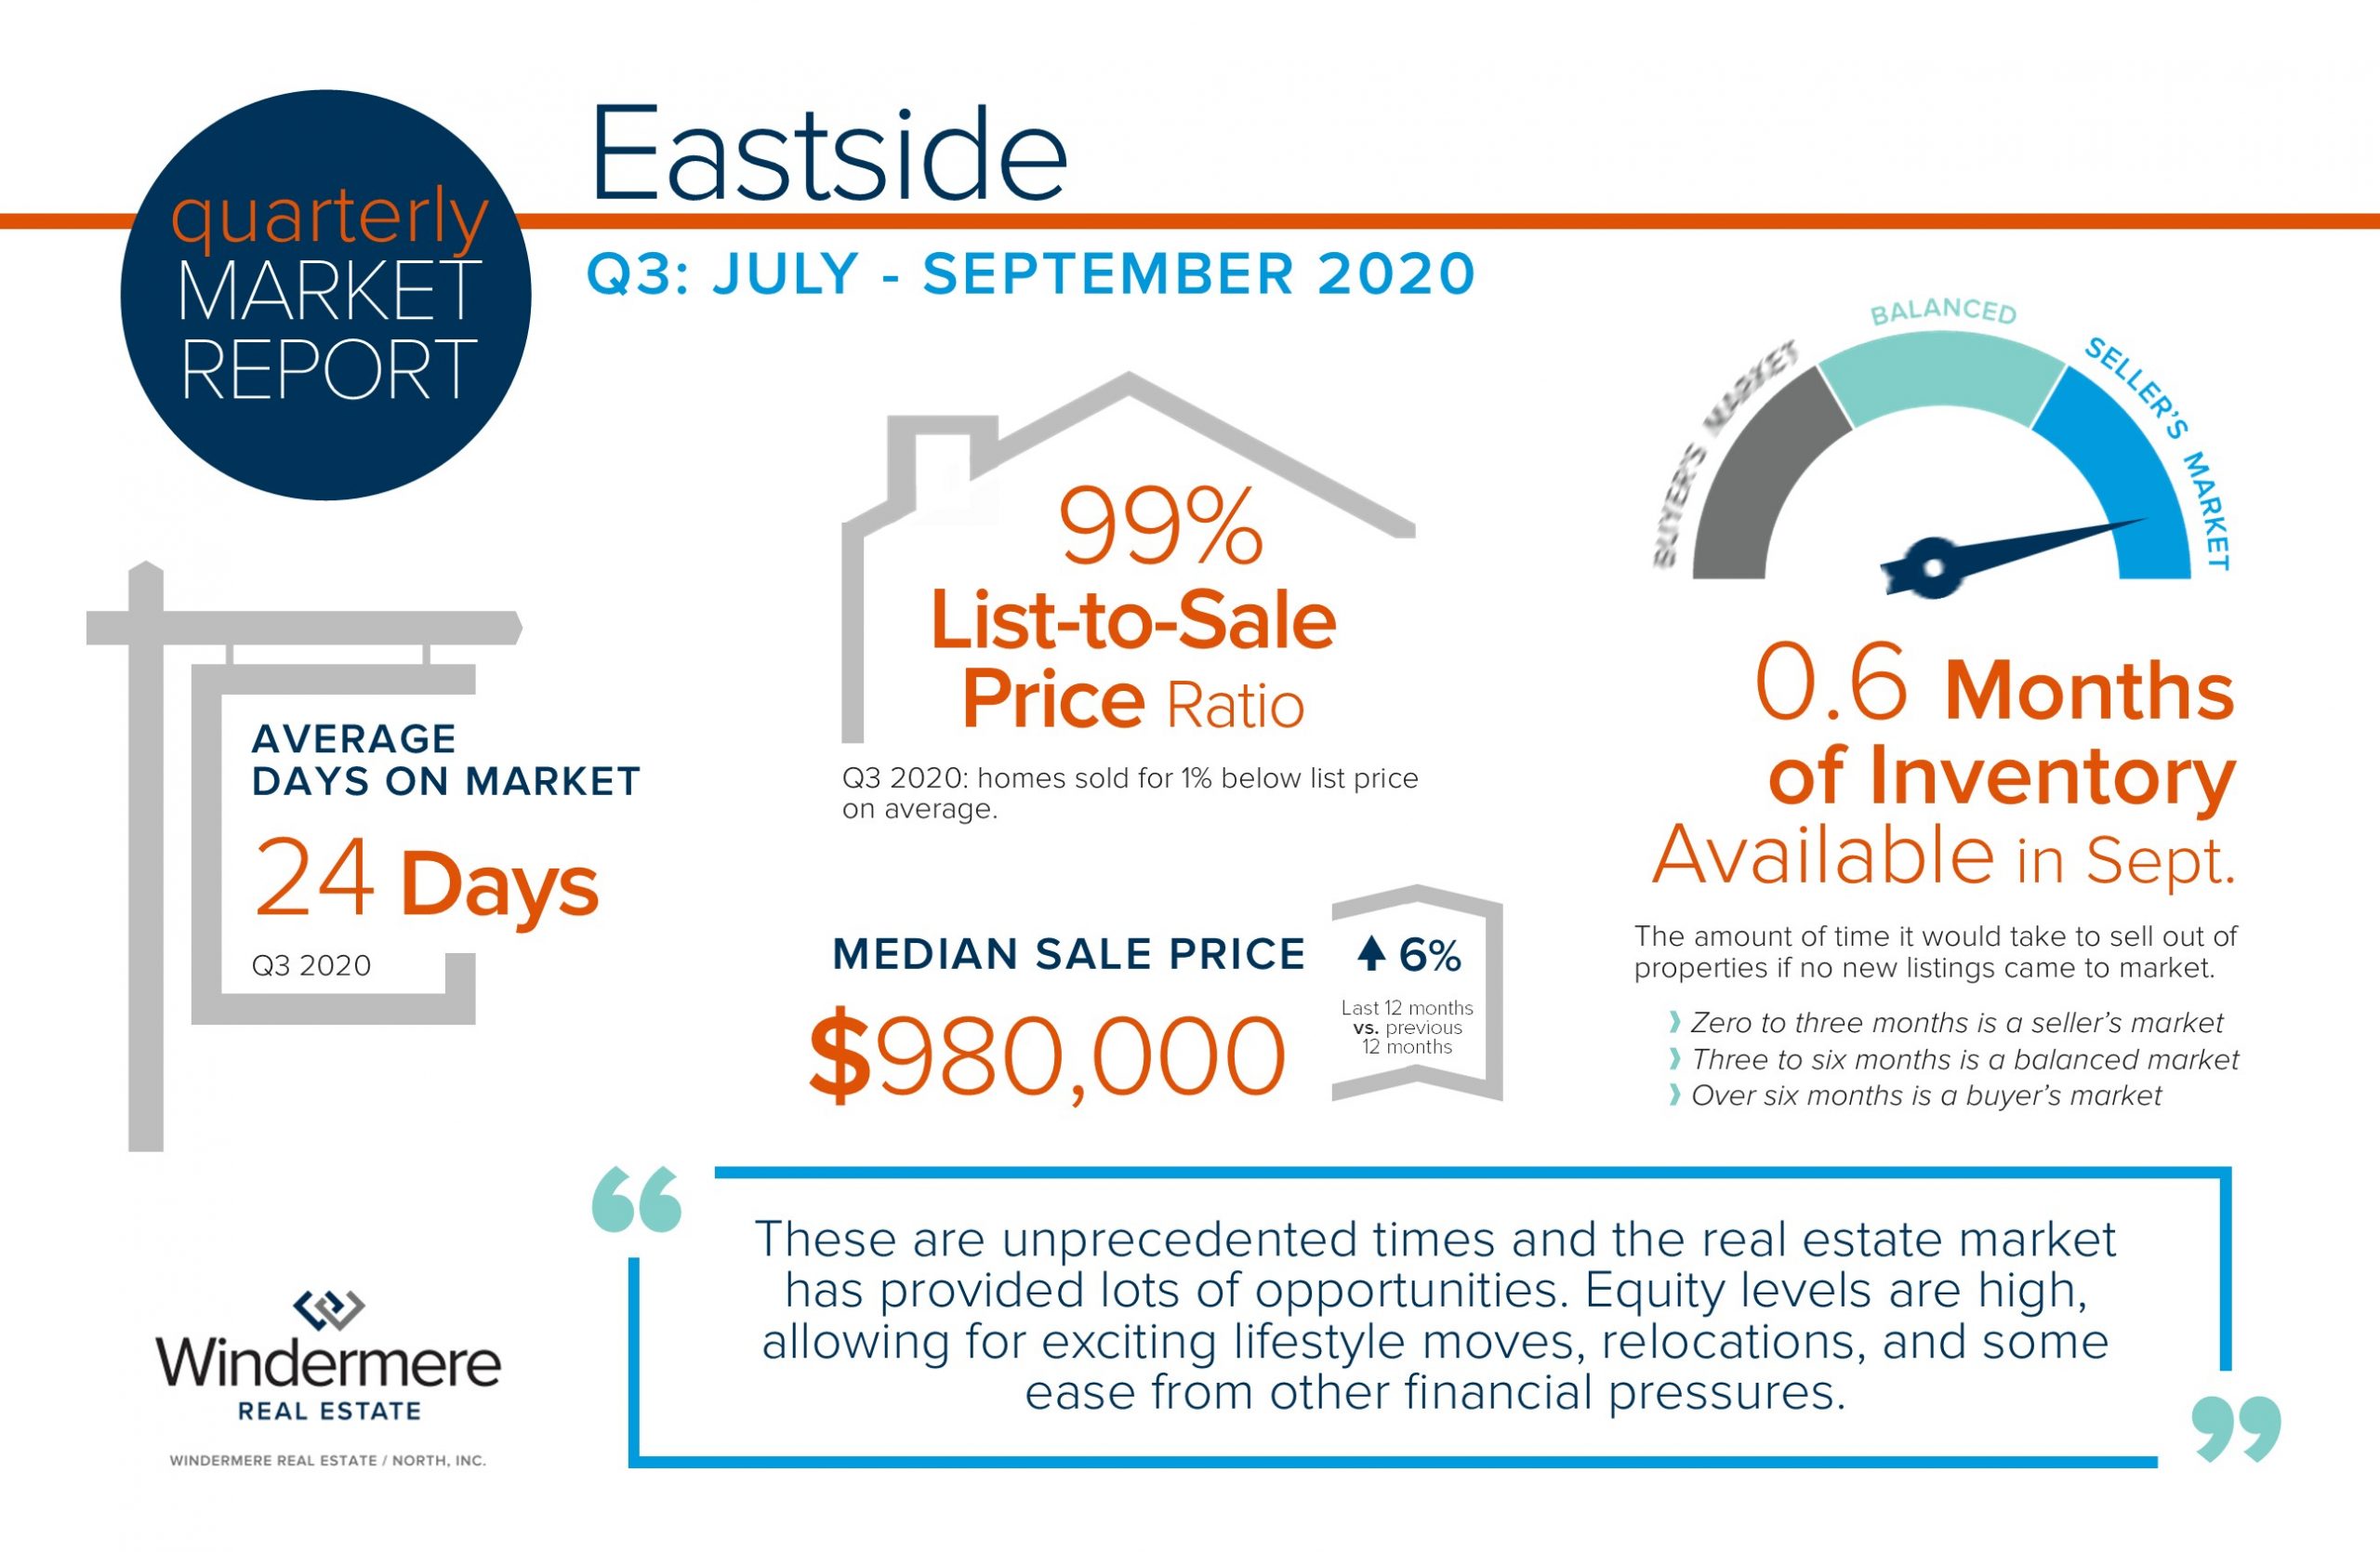
Eastside Quarterly Market Trends – Q3 2019

Increased pending activity is an indication of strong buyer demand which is very much being driven by historically low interest rates, a thriving job market, and an overall strong local economy. In fact, interest rates are an entire point lower than they were a year ago! This affords buyers a price point that is 10% higher over last year while maintaining the same monthly payment. A year ago, the monthly payment for a home at $900,000 is the same for a home at $990,000 today. Today’s rates coupled with tempered price appreciation provides increased affordability for buyers, which in turn is providing a healthy audience for sellers.  After many years of strong price increases, many sellers are moving their equity to the next lifestyle home they desire.

This is only a snapshot of the trends on the Eastside; please contact me if you would like further explanation of how the latest trends relate to you.

Community Info October 15, 2019

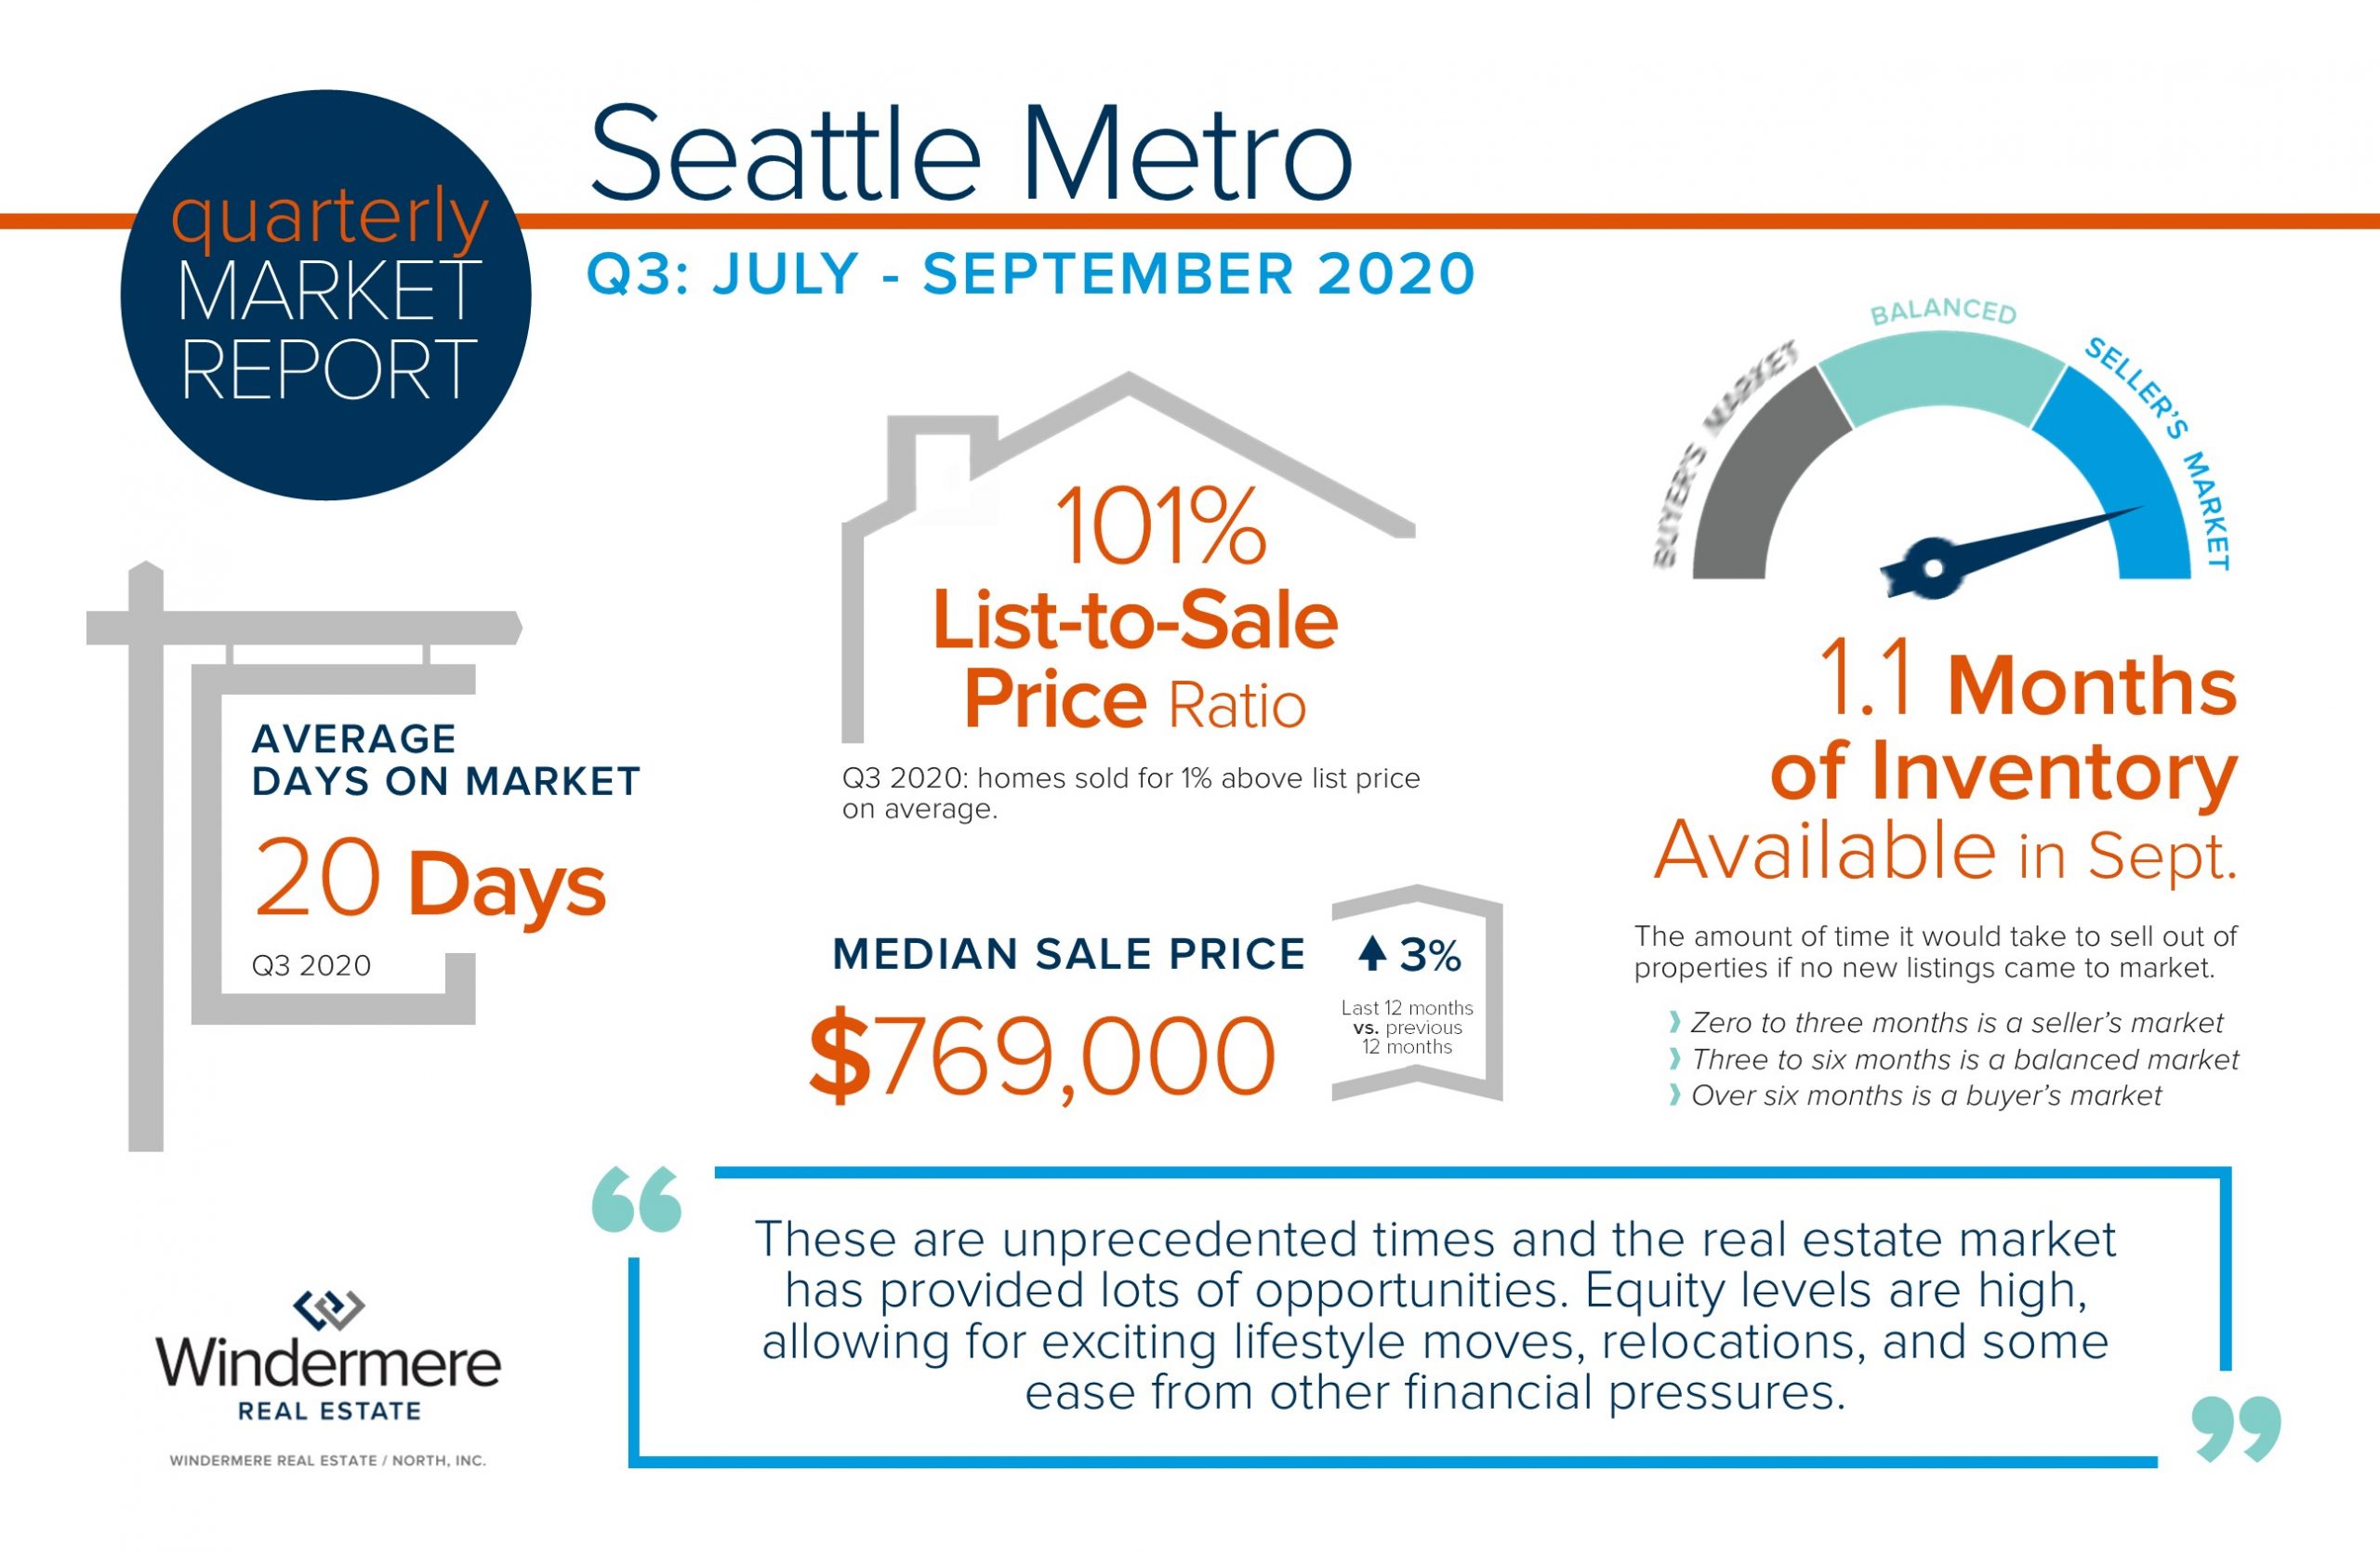
Seattle Metro Quarterly Market Trends – Q3 2019

Increased pending activity is an indication of strong buyer demand which is very much being driven by historically low interest rates, a thriving job market, and an overall strong local economy. In fact, interest rates are an entire point lower than they were a year ago! This affords buyers a price point that is 10% higher over last year while maintaining the same monthly payment. A year ago, the monthly payment for a home at $750,000 is the same for a home at $825,000 today. Today’s rates coupled with tempered price appreciation provides increased affordability for buyers, which in turn is providing a healthy audience for sellers.  After many years of strong price increases, many sellers are moving their equity to the next lifestyle home they desire.

This is only a snapshot of the trends in the Seattle Metro area; please contact me if you would like further explanation of how the latest trends relate to you.

Community Info October 15, 2019

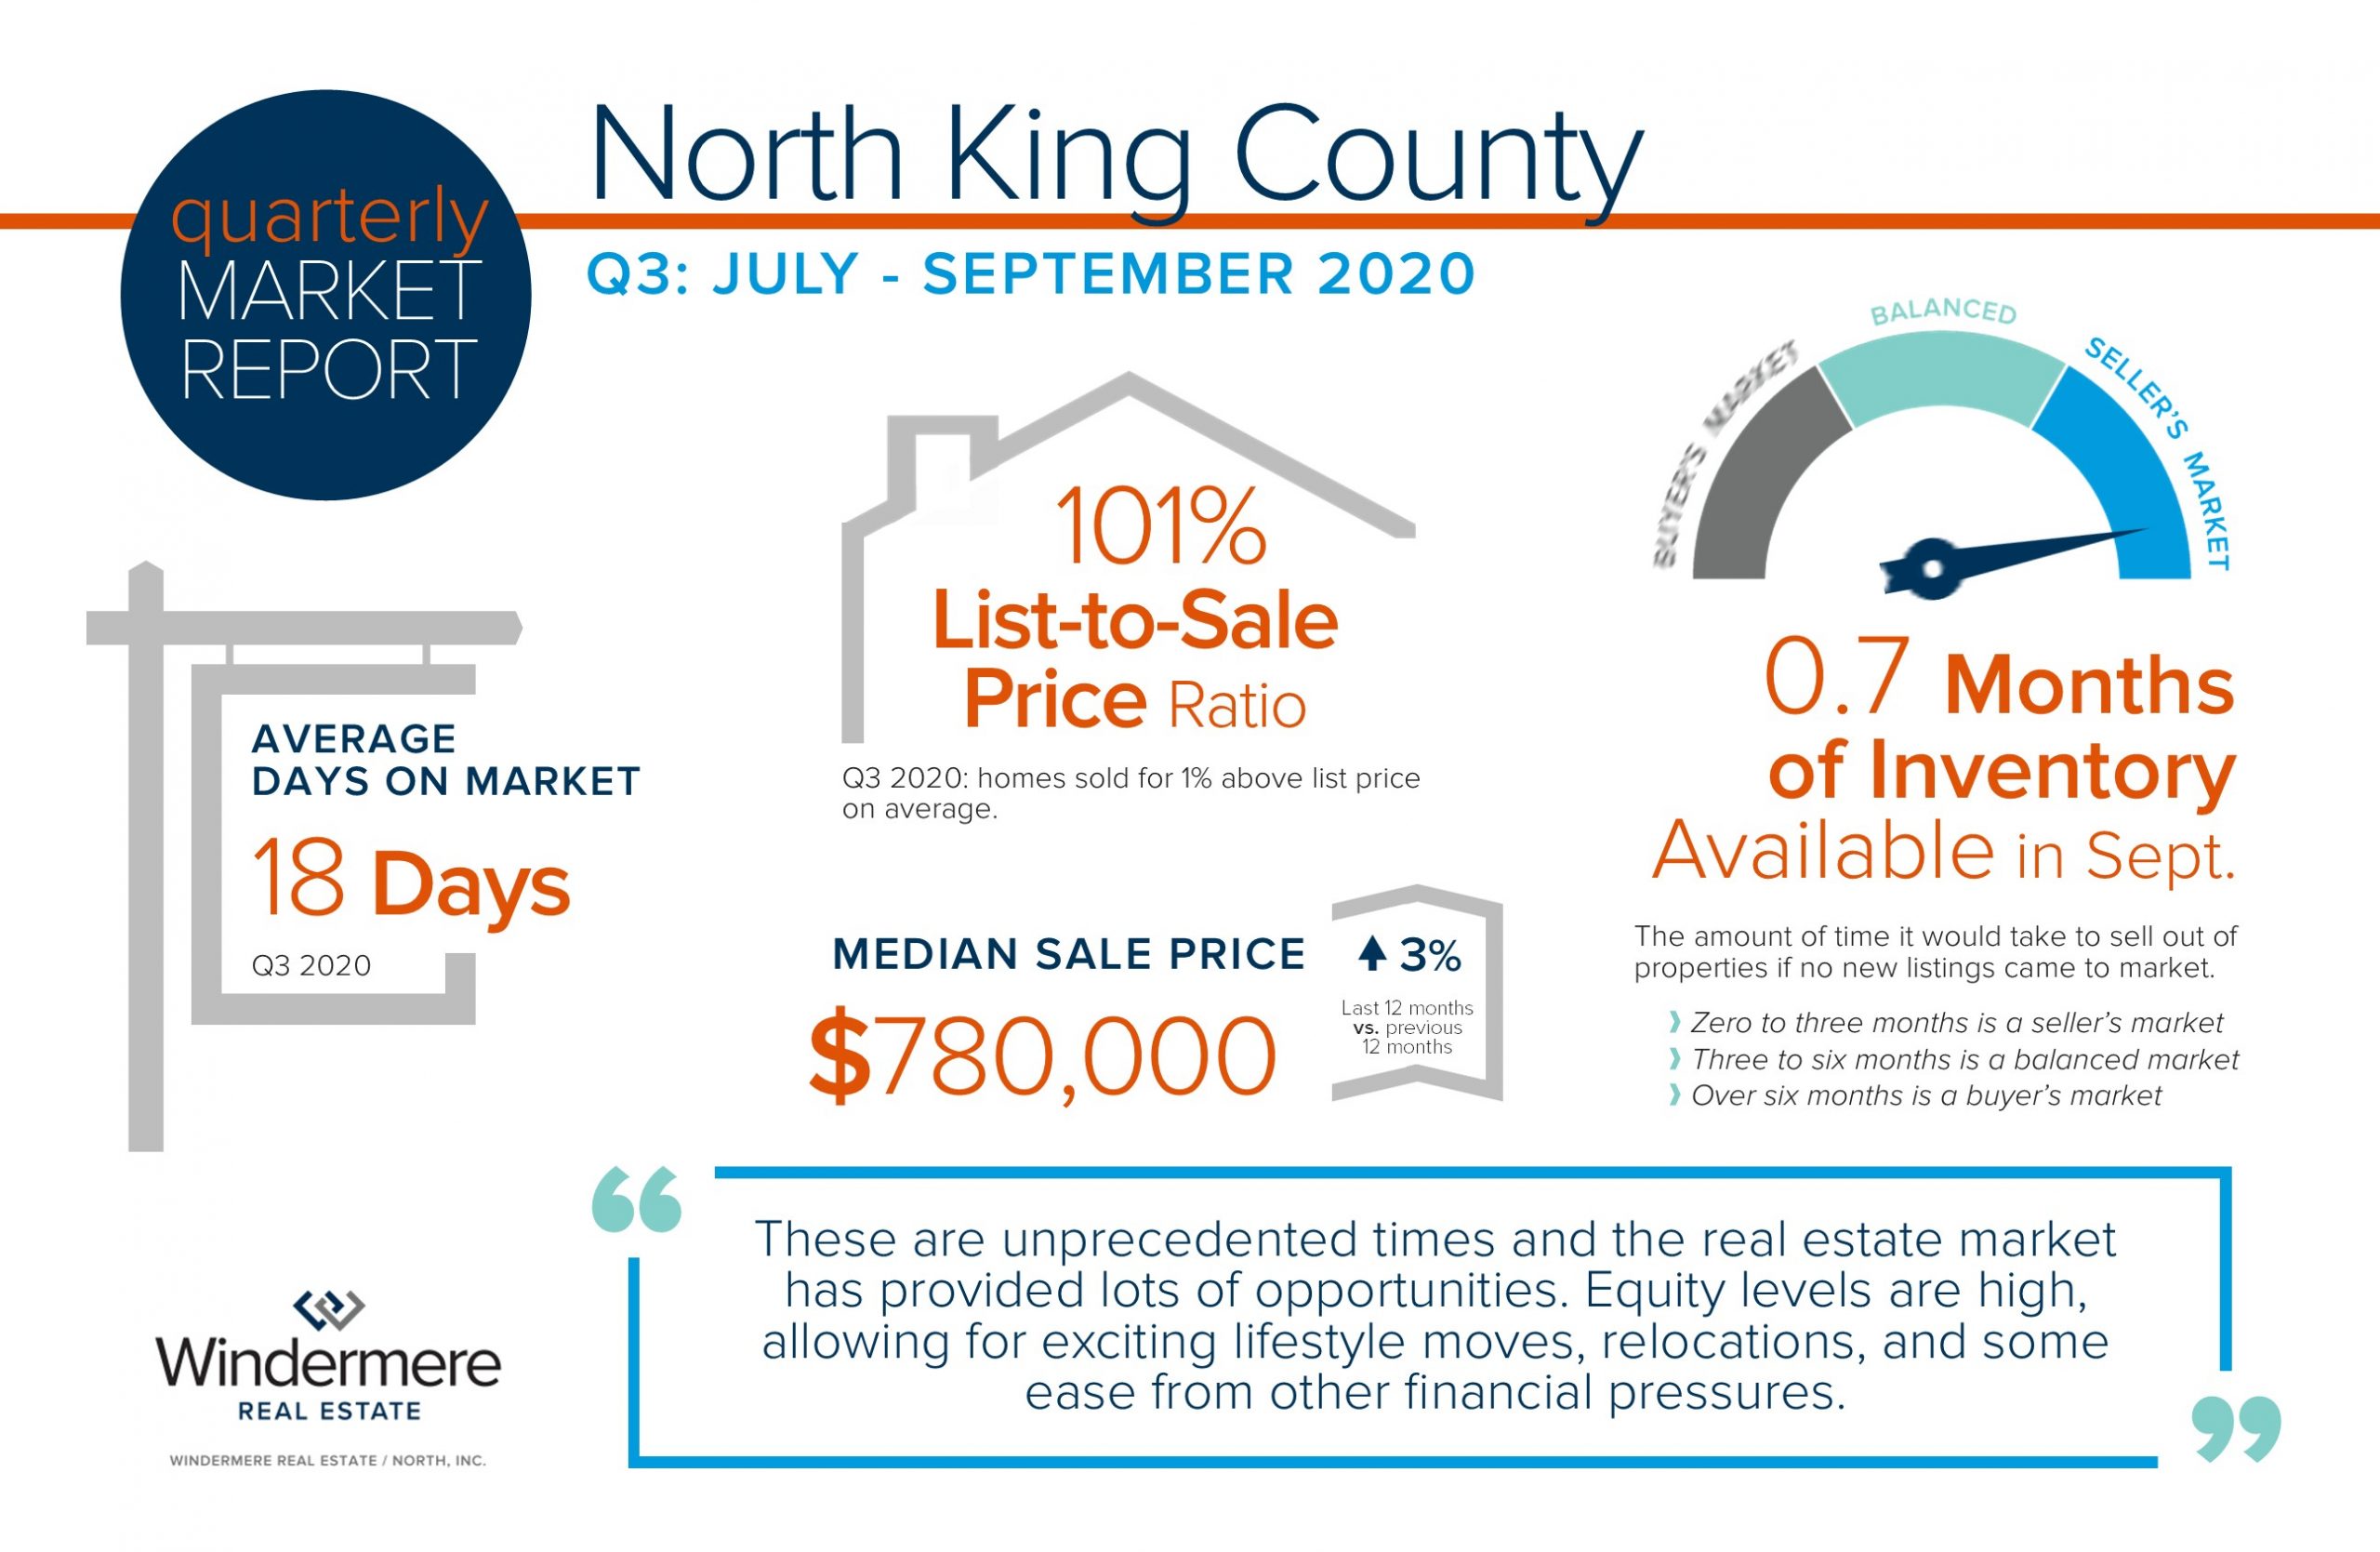
North King County Quarterly Market Trends – Q3 2019

Increased pending activity is an indication of strong buyer demand which is very much being driven by historically low interest rates, a thriving job market, and an overall strong local economy. In fact, interest rates are an entire point lower than they were a year ago! This affords buyers a price point that is 10% higher over last year while maintaining the same monthly payment. A year ago, the monthly payment for a home at $750,000 is the same for a home at $825,000 today. Today’s rates coupled with tempered price appreciation provides increased affordability for buyers, which in turn is providing a healthy audience for sellers.  After many years of strong price increases, many sellers are moving their equity to the next lifestyle home they desire.

This is only a snapshot of the trends in north King County; please contact me if you would like further explanation of how the latest trends relate to you.

Community Info October 15, 2019

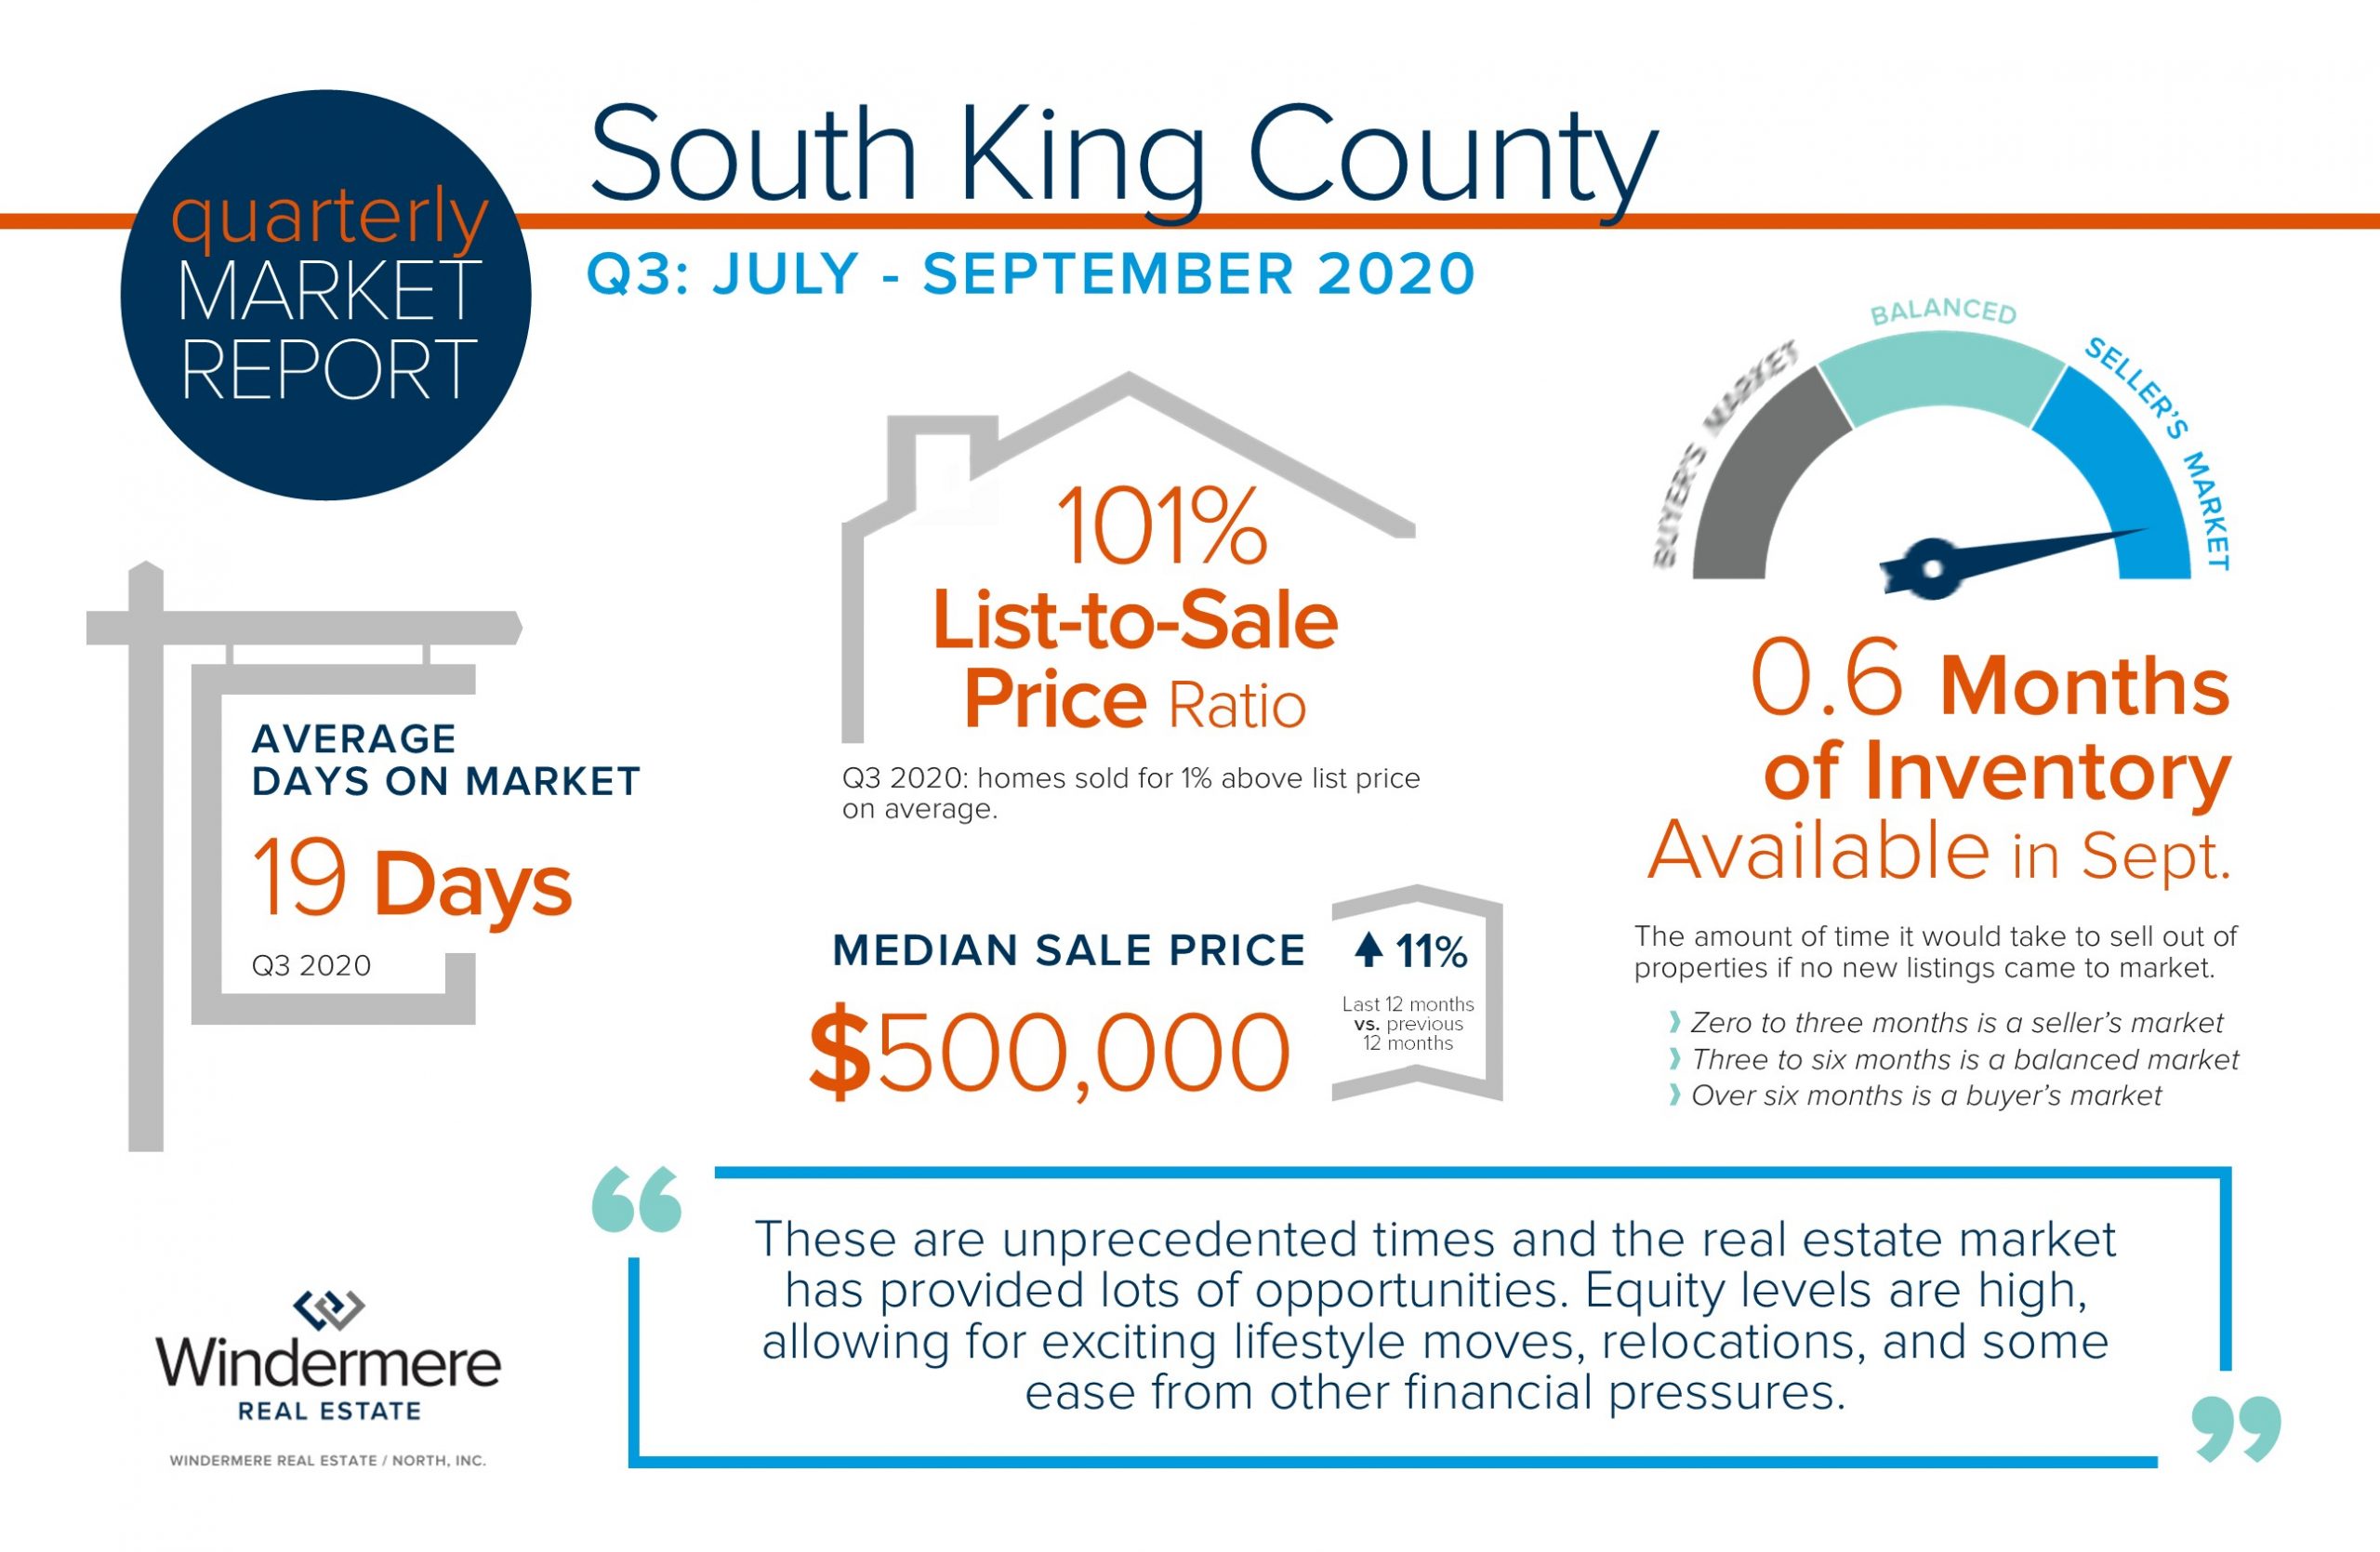
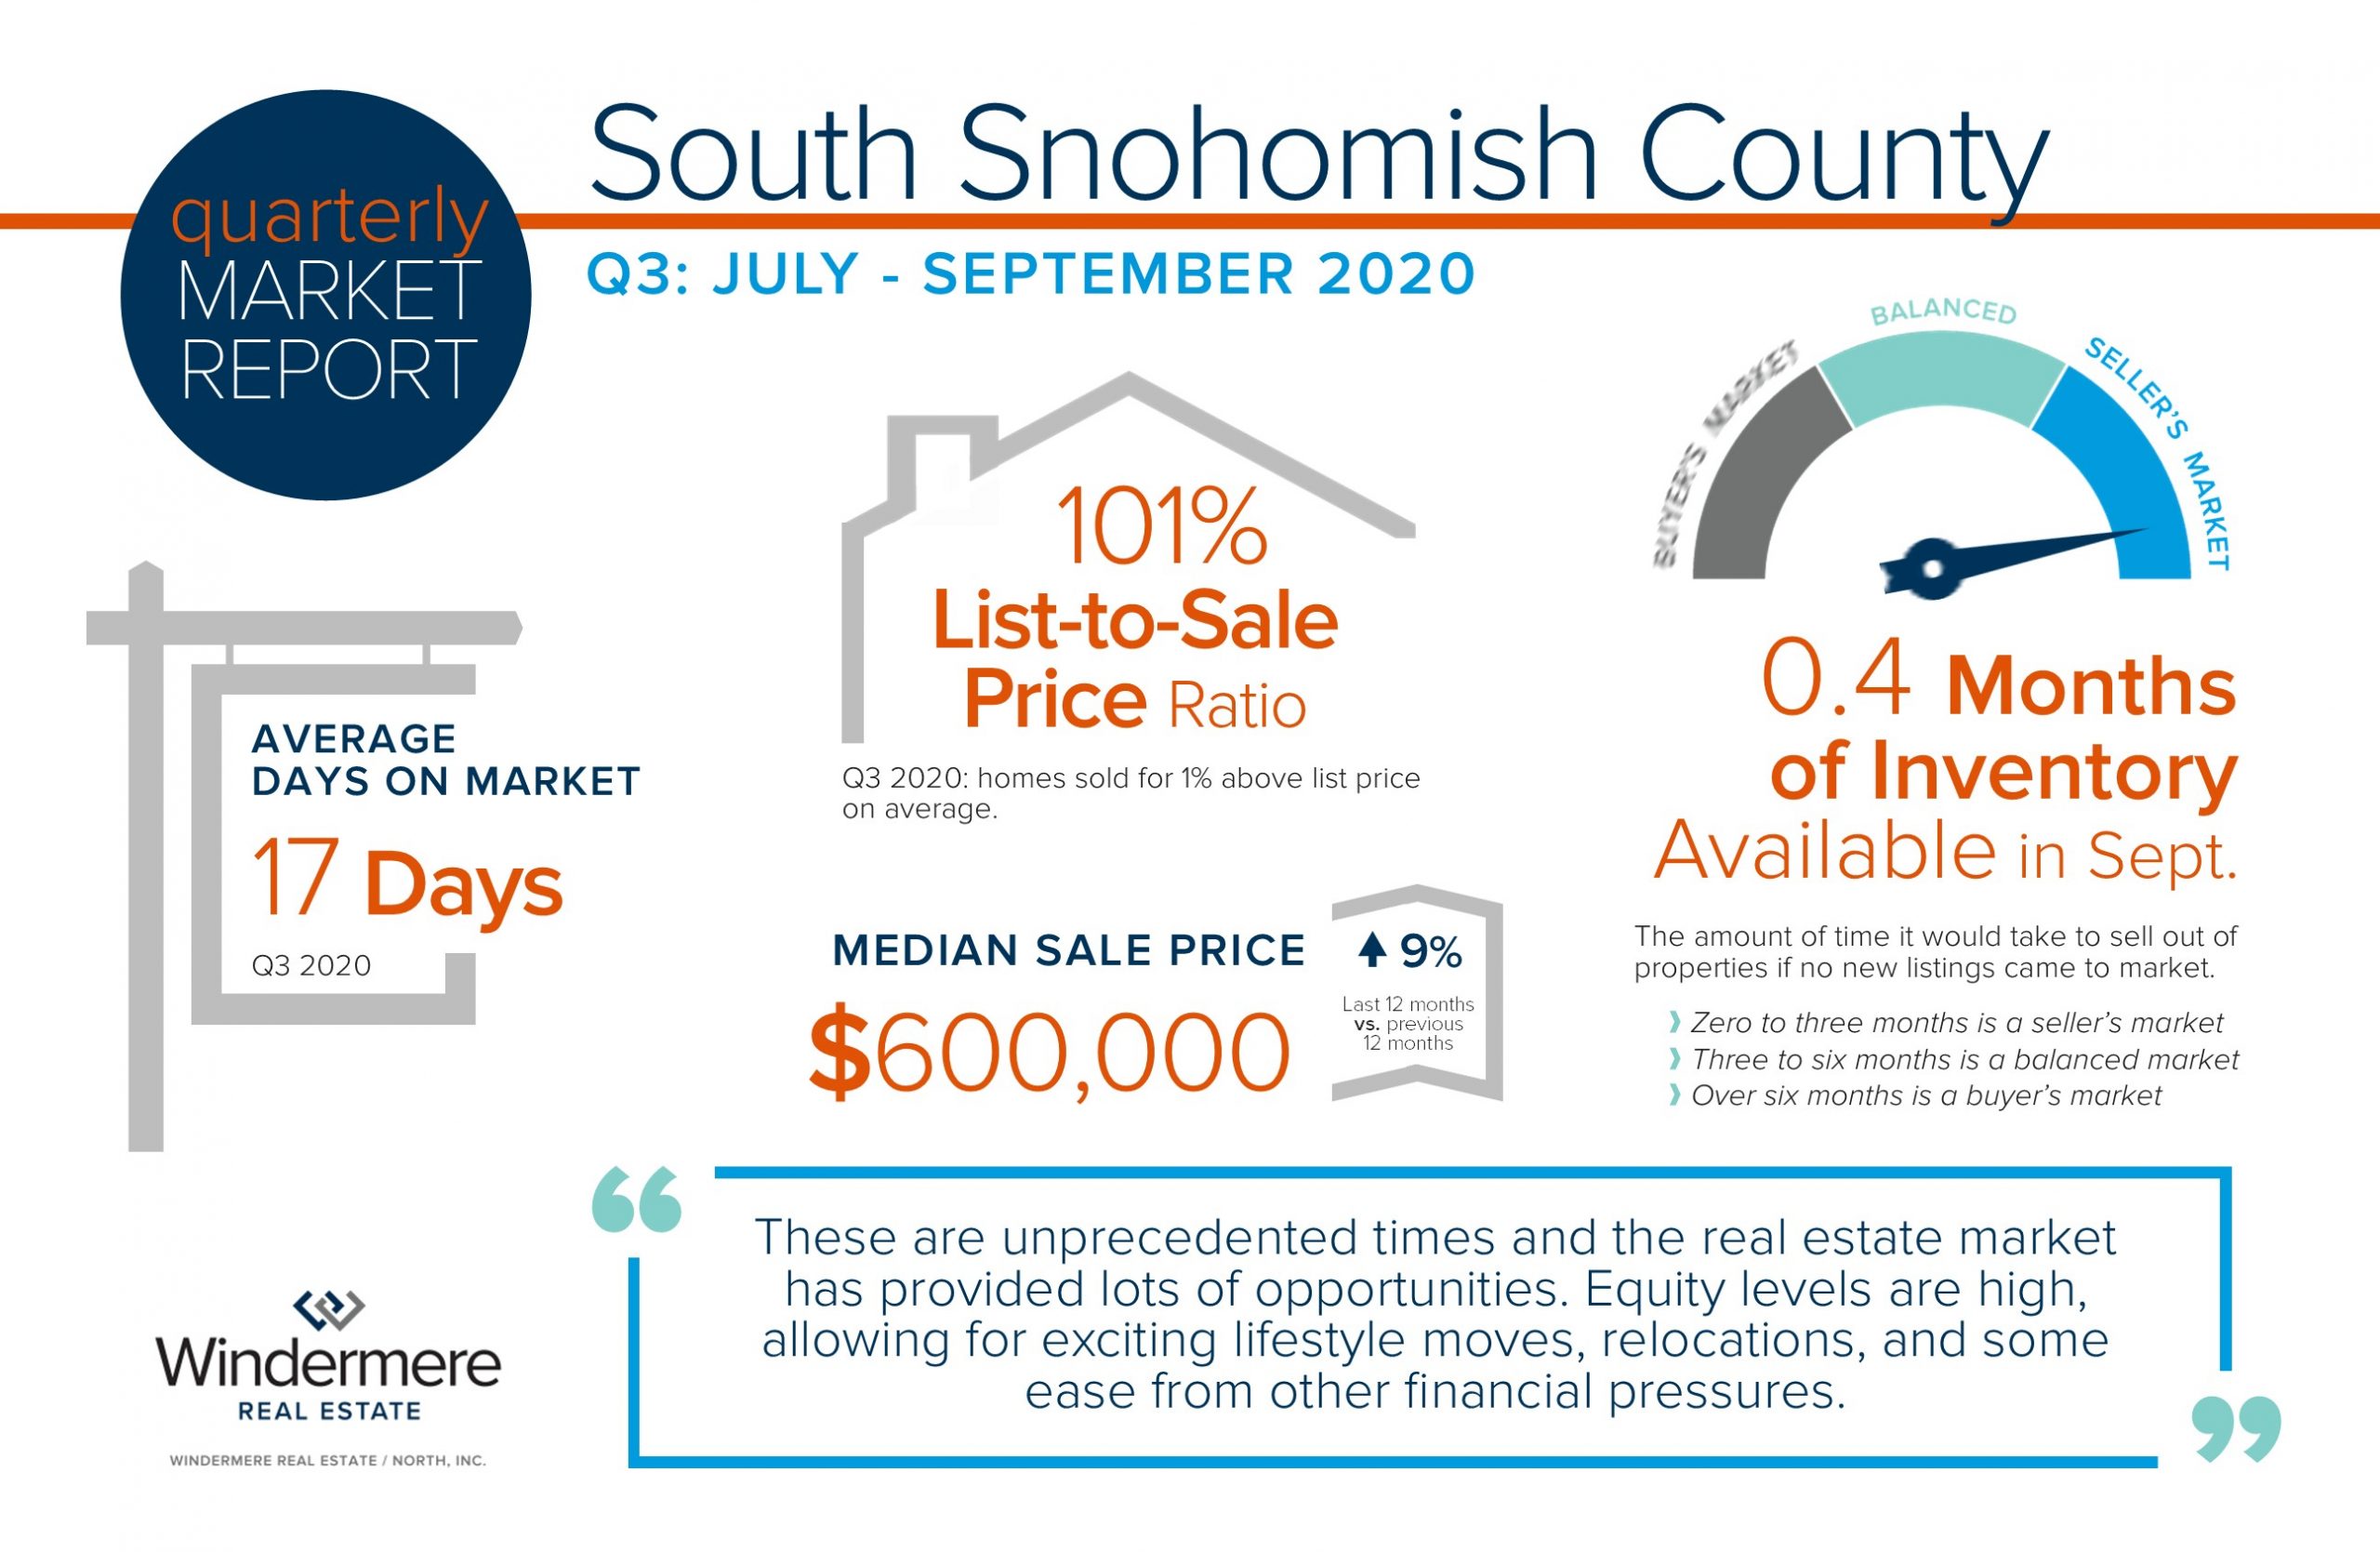
South Snohomish County Quarterly Market Trends – Q3 2019

Increased pending activity is an indication of strong buyer demand which is very much being driven by historically low interest rates, a thriving job market, and an overall strong local economy. In fact, interest rates are an entire point lower than they were a year ago! This affords buyers a price point that is 10% higher over last year while maintaining the same monthly payment. A year ago, the monthly payment for a home at $550,000 is the same for a home at $605,000 today. Today’s rates coupled with tempered price appreciation provides increased affordability for buyers, which in turn is providing a healthy audience for sellers.  After many years of strong price increases, many sellers are moving their equity to the next lifestyle home they desire.


This is only a snapshot of the trends in south Snohomish County; please contact me if you would like further explanation of how the latest trends relate to you.

Community Info October 15, 2019

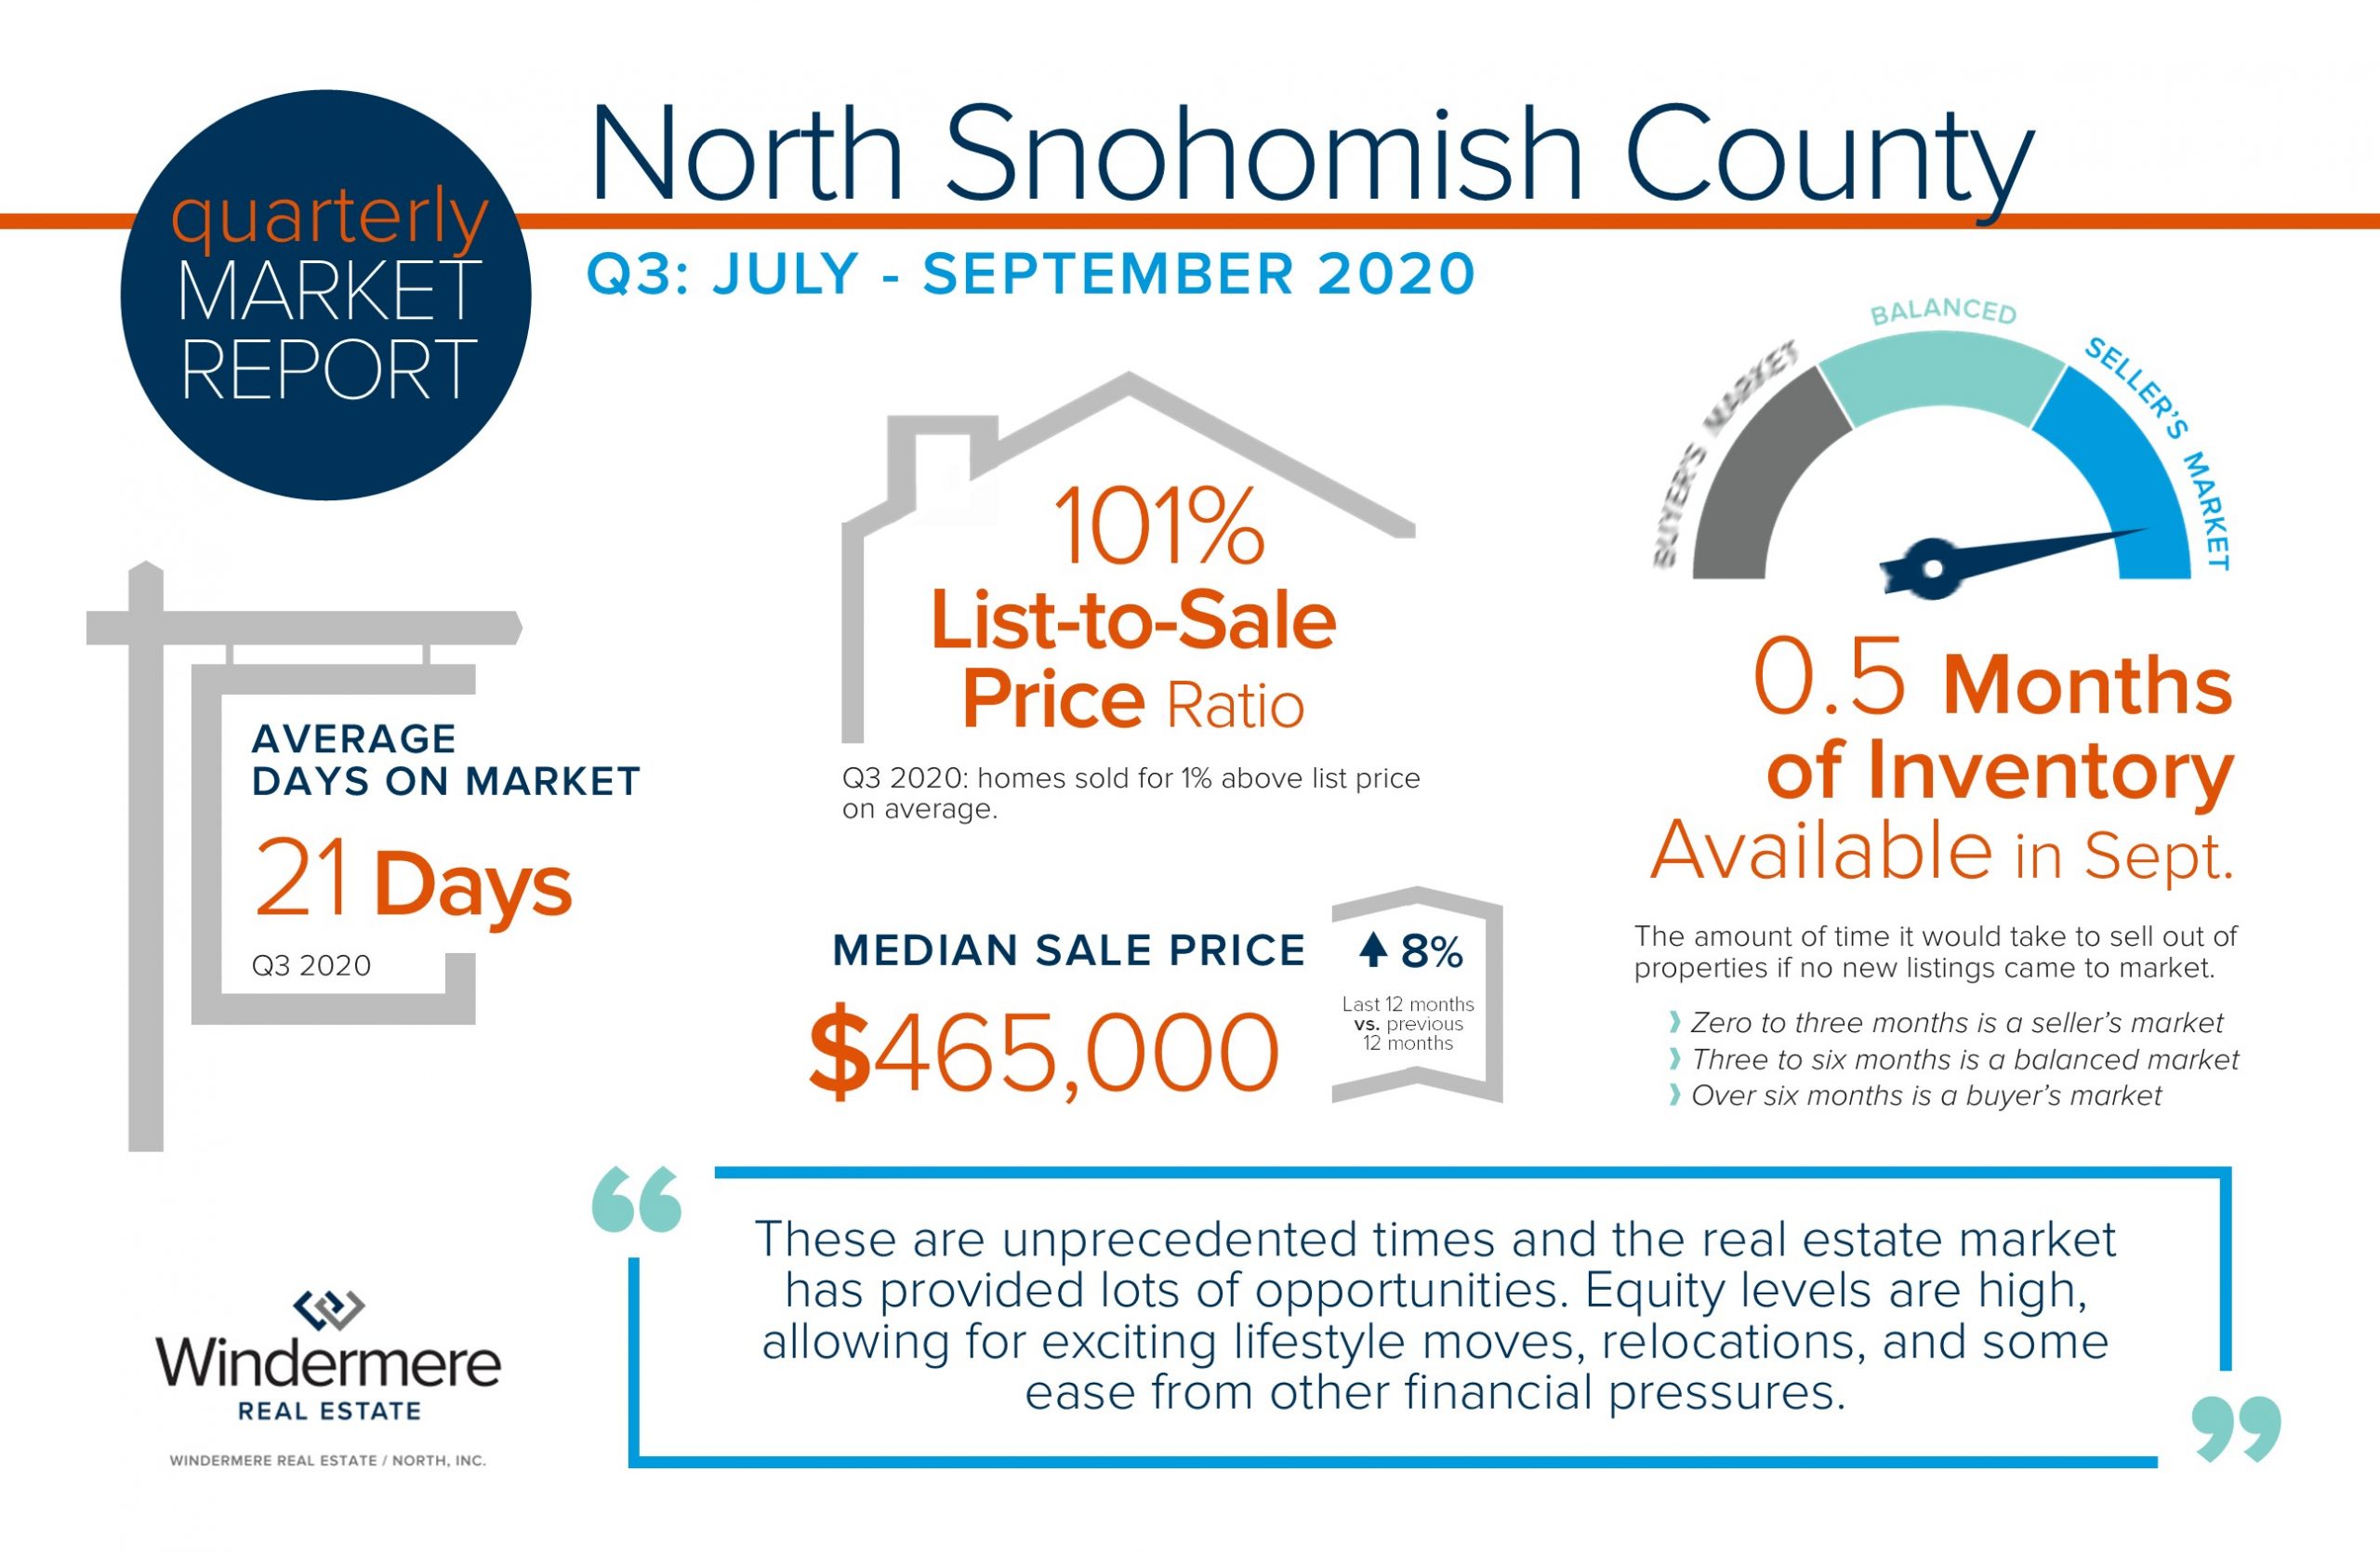
North Snohomish County Quarterly Market Trends – Q3 2019

Increased pending activity is an indication of strong buyer demand which is very much being driven by historically low interest rates, a thriving job market, and an overall strong local economy. In fact, interest rates are an entire point lower than they were a year ago! This affords buyers a price point that is 10% higher over last year while maintaining the same monthly payment. A year ago, the monthly payment for a home at $450,000 is the same for a home at $495,000 today. Today’s rates coupled with tempered price appreciation provides increased affordability for buyers, which in turn is providing a healthy audience for sellers.  After many years of strong price increases, many sellers are moving their equity to the next lifestyle home they desire.

This is only a snapshot of the trends in north Snohomish County; please contact me if you would like further explanation of how the latest trends relate to you.

Community Info September 30, 2019

How Long Things Last

How Long Things Last

We all know that nothing lasts forever, but when everything is working fine it is easy to forget that all of the systems and appliances in your home have a finite lifespan. Keep this information in mind, whether you are buying or selling a home, budgeting for improvements, or deciding between repairing and replacing.

Here’s a brief look at some of the components of your home and their average lifespans (courtesy of the National Association of Home Builders)


ROOFING, SIDING, WINDOWS & DECKS. You can expect slate or tile roofs to last around 50 years, wood shingles 25-30, metal will get you about 25 years, while asphalts typically last about 20 years. The lifespan for siding can vary quite a bit. Brick will last 100 years or more, aluminum about 80 years and stucco will probably last you 25 years. Wood siding can last anywhere from 10 to 100 years depending on the climate you live in and how it is maintained. Both aluminum and vinyl windows will last 15 to 20 years, while unclad wood windows can have a life of 30 years or more. Cedar decks will average 15-25 years as long as they are properly treated and cleaned, and a high quality composite deck will last 30 years with minimal maintenance.


FLOORING. The natural flooring materials such as wood, marble, slate or granite will all last 100 years or more, while tile has an average life of 70-100 years. Vinyl can last up to 50 years, while laminate and linoleum will get you up to 25 years. Expect your carpet to last 8-10 years, depending on use.


KITCHEN & BATH. Laminate countertops can have a life of 20 years or more, but it will vary depending on use. Wood, tile and stone should last a lifetime, and cultured marble will typically see a lifespan of 20 years. You can expect your stainless steel sink to last you about 30 years, while an enamel-coated sink will give you five to 10 years. Slate, granite, soapstone and copper will be around for 100 years or more. Bathroom faucets should give you about 20 years, and toilets will average a 50-year lifespan, although some of the parts will need replacing.


APPLIANCES. The lifespan of appliances will vary widely depending on the appliance, the brand, model, and use. Use these average lifespan numbers as a rough guide for when it may make more sense to replace rather than repair. Gas ranges tend to have the longest lifespan of your major appliances, giving around 15 years of use. Electric ranges on the other hand, are closer to 13 years, which is also the expected lifespan for standard refrigerators and clothes dryers. Your garbage disposal should give you about 10 years of use, while the dishwasher and microwave will be around nine years. You can expect your electric furnace to last about 15 years, 18 for gas and 20 for oil-burning. Central air systems will live 10 to 15 years on average.


Check out the NAHB website for more information.

Monthly Newletter September 30, 2019

Monthly Newsletter – September 2019

2019 has been a year where we have continued to gain more balance in the real estate market. Inventory levels have increased, days on market are longer, negotiations have opened up, and the constricted multiple-offer market is no longer the norm. It has been comforting to see price appreciation temper and move towards more normal, historical levels. Today’s market certainly seems more sustainable and has provided some great opportunities for both buyers and sellers, especially for those that are both.

Recently, I did analysis on a new phenomenon that has presented itself. This is the presence of a dual market. A dual market is when you have different market conditions within the same overarching real estate market. This duality presents amazing opportunities for sellers who are also buyers, depending on where they want to go.

Two dual markets that I have discovered are the move-up market and the move-out market. The move-up market is when you sell the home you are in and move up to an upgraded home in a higher price point. For example, in Edmonds, WA there are many people who are interested in selling their current home and upgrading to a view home. When I analyzed the statistics in both sections of the Edmonds market it appears that a dual market is presenting itself.

In August, all homes in Edmonds under $1M had an absorption rate of 88% while all homes over a $1M, 16%. Months of inventory based on pending sales under $1M was only one month of available inventory, and over $1M, six months! That is the difference of a seller’s market under $1M to a balanced market teetering on a buyer’s market over $1M. After many solid years of strong appreciation, folks that are looking to cash out the equity on their current home and move it into a view home have the opportunity to move their investment with a sizable down payment and upgrade to the lifestyle they have been dreaming about.

Let’s also not forget to mention today’s interest rates. They are a point lower than they were a year ago, affording buyer’s 10% more buying power. For example, a one-point lower rate on a home priced at $1.2M will now afford a buyer the purchase of a home at $1.32M with the same monthly payment. Couple that with price appreciation tempering and you have a move-up market heyday in the making!

The other dual market that is exciting to witness is the move-out market. This is prevalent for the Baby Boomers looking to cash out on the home that they enjoyed during their working years, typically near job centers, and relocate to an outlying area to retire. The chart below illustrates the market conditions and prices in the urban markets and compares them to the market conditions in some of the most popular retirement destinations in the state, such as Sequim, Island County, Okanogan County, and Chelan County.  Note, if there is a destination that is not listed and you would like the statistics, please reach out. I have access to many markets across the state and beyond.  Also, I am a part of an agent network that I can access to put you in touch with capable experts across or out of the state to help educate and serve your real estate needs with these markets.

The previous, hard-core seller’s market we experienced was quite the ride and built up some pretty major equity gains for homeowners across the board. It was exciting, but these more normal conditions are more pliable and comfortable. They allow for moves that don’t require physically moving twice, high price escalations, or constantly getting beat out by other buyers to succeed. Overall, there is just more breathing room. Are there homes that get multiple offers, yes! Homes that are expertly brought to market with thoughtful pricing and dialed-in preparation are having fun with their results. Opportunities abound for both buyers and sellers, and in a market with more options it is important to align with an agent that can help navigate all the choices.

If you are curious about the opportunities these dual markets present, please reach out. It is my goal to help keep my clients educated and empowered to make strong decisions. This is especially rewarding when it leads to their next chapter in life, which are amazing transitions to be a part of. Stay tuned for next month’s newsletter, when I will feature opportunities in the condominium market and how this duality is starting to take shape.

Nothing feels more like fall than pumpkin picking, hay rides and corn mazes. Get your latte in hand and head out to any one of these great, local farms to have some harvest fun and find that perfect jack-o-lantern to light up your porch.
We all know that nothing lasts forever, but when everything is working fine it is easy to forget that all of the systems and appliances in your home have a finite lifespan. Keep this information in mind, whether you are buying or selling a home, budgeting for improvements, or deciding between repairing and replacing.

Here’s a brief look at some of the components of your home and their average lifespans (courtesy of the National Association of Home Builders)

ROOFING, SIDING, WINDOWS & DECKS. You can expect slate or tile roofs to last around 50 years, wood shingles 25-30, metal will get you about 25 years, while asphalts typically last about 20 years. The lifespan for siding can vary quite a bit. Brick will last 100 years or more, aluminum about 80 years and stucco will probably last you 25 years. Wood siding can last anywhere from 10 to 100 years depending on the climate you live in and how it is maintained. Both aluminum and vinyl windows will last 15 to 20 years, while unclad wood windows can have a life of 30 years or more. Cedar decks will average 15-25 years as long as they are properly treated and cleaned, and a high quality composite deck will last 30 years with minimal maintenance.

FLOORING. The natural flooring materials such as wood, marble, slate or granite will all last 100 years or more, while tile has an average life of 70-100 years. Vinyl can last up to 50 years, while laminate and linoleum will get you up to 25 years. Expect your carpet to last 8-10 years, depending on use.

KITCHEN & BATH. Laminate countertops can have a life of 20 years or more, but it will vary depending on use. Wood, tile and stone should last a lifetime, and cultured marble will typically see a lifespan of 20 years. You can expect your stainless steel sink to last you about 30 years, while an enamel-coated sink will give you five to 10 years. Slate, granite, soapstone and copper will be around for 100 years or more. Bathroom faucets should give you about 20 years, and toilets will average a 50-year lifespan, although some of the parts will need replacing.

APPLIANCES. The lifespan of appliances will vary widely depending on the appliance, the brand, model, and use. Use these average lifespan numbers as a rough guide for when it may make more sense to replace rather than repair. Gas ranges tend to have the longest lifespan of your major appliances, giving around 15 years of use. Electric ranges on the other hand, are closer to 13 years, which is also the expected lifespan for standard refrigerators and clothes dryers. Your garbage disposal should give you about 10 years of use, while the dishwasher and microwave will be around nine years. You can expect your electric furnace to last about 15 years, 18 for gas and 20 for oil-burning. Central air systems will live 10 to 15 years on average.

Check out the NAHB website for more information.

Monthly Newletter August 30, 2019

Monthly Newsletter – August

Most recently, buyers have enjoyed more selection in the marketplace which has led to more open negotiations versus bidding wars. This is illustrated by an increase in average Days on Market and a decrease in the average Sold-to-List Price Ratios complete-year over year (the last 12 months over the previous 12 months). In King County, the average Days on Market increased from 22 days to 36 days complete-year over year, and the Sold-to-List Price Ratio decreased from 101% to 98%. In Snohomish County, the average Days on Market increased from 25 to 35 days complete-year over year, and the Sold-to-List Price Ratio decreased from 100% to 98%.

Buyers have had more selection to choose from which has tempered price growth complete-year over year. Median price remains even in King County and up 3% in Snohomish County. Multiple offers are not as commonplace as they were, but terms such as inspection contingencies and home sale contingencies are doable in some areas and price ranges. This balancing out has created some more normal terms for buyers, while sellers are getting close to full price on average and cashing out on the above-average appreciation we enjoyed from 2012 to 2018.

It is still a seller’s market, yet we are heading towards balance. The months of available inventory based on pending sales (the amount of time it would take to sell out of homes if no new homes came to market) currently sits at 1.7 months in King County and 1.5 months in Snohomish County. Zero to 3 months is a seller’s market, 3-6 months a balanced market, and 6+ months a buyer’s market. In 2017 to early 2018, inventory levels were commonly under one month, which was a very volatile and constricted environment within which to purchase a home. The direction towards balance is welcome and providing much more comfort when making a move.

The inventory levels are an amazingly beneficial phenomenon due to the fact that buyers are simultaneously enjoying the lowest interest rates we’ve had since 2016! Currently, the 30-year mortgage rate is hovering around 3.6% and the 15-year around 3.07% according to Freddie Mac. Not only are rates the lowest we’ve seen in 3 years, but they are an entire point lower than they were a in Q4 of 2018. When rates crested 4.5% last year, we saw a marked reduction in pending sales. This highlights the recent opportunities that have come alive for buyers to secure such low debt service and for sellers to have a larger audience. When rates rise, folks reassess and sometimes step aside, which is why this current opportunity should be taken advantage of.

This is meaningful because the rule of thumb is that for every one-point decrease in interest rate, a buyer gains ten percent in purchase power. For example, if a buyer is shopping for a $500,000 home and the rate decreases by a point during their search, they can up their price ceiling to $550,000 and keep the same monthly payment. This is huge, especially in the wake of intense price growth over the last 6-7 years, which priced many buyers out of the market. Buyers that took a break and stepped to the sidelines in the past may want to consider their opportunities now. This is the most favorable buyer environment (inside of a seller’s market) we’ve seen in some time!
This recent decrease in rate is helping the move-up market come alive. What is great about this, is that it opens up inventory for the first-time buyer and helps complete the market cycle. First-time buyers are abundant right now as the Millennial generation is gaining in age and making big life transitions such as buying real estate. According to Nerd Wallet, 49% of all Millennials have a home purchase in their 5-year plan. The rates are also providing very low debt service for investors, second-home buyers, and down-size buyers headed toward retirement.

Will these rates last forever? Simply put, no! According to Freddie Mac, rates should increase closer to the 4’s as we round out 2019 and head into 2020. While still staying well below the 30-year average of 6.85%, increases are increases, and securing today’s rate could be hugely beneficial from a cost-saving perspective. Just like the 1980’s when folks were securing mortgages at 18%, the people that lock down on a rate from today will be telling these stories to their grandchildren. Note the 30-year average – it is reasonable to think that higher rates must be in our future at some point.

So what does this mean for you? If you have considered making a move, or even your first purchase, today’s rates are a huge advantage in helping make a move more affordable. If you are a seller, bear in mind that today’s interest rate market is creating strong buyer demand, providing a healthy buyer pool for your home. As a homeowner who has no intention to make a move, now might be the time to consider a refinance. What is so exciting about these refinances, is that it is not only possible to reduce your monthly payment, but also your term, depending on which rate you would be coming down from.

If you would like additional information on how today’s interest rates pertain to your housing goals, please contact me. I would be happy to educate you on homes that are available, do a market analysis on your current home, and/or put you in touch with a reputable mortgage professional to help you crunch numbers. Real estate success is rooted in being accurately informed, and it is my goal to help empower you to make sound decisions for you and your family.

I am pleased to present the second-quarter 2019 edition of the Gardner Report, which provides insights into select counties of the Western Washington housing market. This analysis is provided by Windermere Real Estate Chief Economist Matthew Gardner. I hope that this information will assist you with making better-informed real estate decisions. For further information about the housing market in your area, please don’t hesitate to contact me.

Click to view the full report

Summer is quickly coming to a close, and it’s time to think about prepping your yard for fall.  Here are a few quick tips to get you started, and a full article here.

Fertilizing
All summer long, plants and grass are using up nutrients in the soil. After months of growing, your soil’s reserves become depleted, which is why a fall fertilizer is great to restore nutrients and give your grass, shrubs, and perennials a boost to help them make it through winter. It is recommended to fertilize once every season.

Stop Pruning and Watering
Late summer and fall might seem like a good time to prune dead flowers and branches, but several experts recommend waiting until spring to prune anything. Pruning stimulates new growth, but with the frost coming, chances are this new growth won’t survive. Pruning also interferes with the plant when it is going dormant.

In late September, you should also stop watering your plants to help them go dormant as well.

Community Info August 22, 2019

Pumpkin Patch Guide 2019

Nothing feels more like fall than pumpkin picking, hay rides and corn mazes. Get your latte in hand and head out to any one of these great, local farms to have some harvest fun and find that perfect jack-o-lantern to light up your porch.

Times, dates & activities may change, please use the provided links to confirm details and hours of operation.


KING COUNTY

Baxter Barn
31929 SE 44th St, Fall City
Pumpkin patch, tractor-pulled hay rides, fresh eggs, gift shop, pony rides, picnic area, farm animals

Carpinito Brothers
1148 Central Ave N, Kent
Pumpkin patch, corn maze, farm fun yard, hay rides, produce stand, concessions

Fall City Farms
3636 Neal Road, Fall City
Pumpkin patch, tractor-pulled hay rides, fresh honey, pre-picked produce, farm animals, snacks and refreshments.

Fox Hollow Family Farm
12031 Issaquah Hobart Rd SE, Issaquah
Pumpkins for sale, hay bale maze, bouncy house, face painting, haunted house, pony rides, petting zoo, farm animals, concessions

Jubilee Farm
229 W Snoqualmie River Rd NE, Carnation
Pumpkins, horse-drawn covered wagon rides, hay rides, hay bale maze

Oxbow Farm
10819 Carnation-Duvall Rd NE, Carnation
Pumpkins, produce, picnic area, playground

Mosby Farm Pumpkin Patch
12747-b South East Green Valley Rd, Auburn
Pumpkin patch, corn maze, tractor-pulled hay rides, snacks and refreshment stand, picnic area

The Nursery at Mt Si
42328 SE 108th St, North Bend
Pumpkin patch, tractor-pulled hay rides

Remlinger Farms
32610 NE 32nd St, Carnation
Pumpkin patch, corn maze, animal barnyard, pony rides, steam train, hay jump

Serres Farm
20306 NE 50th St, Redmond
Pumpkin patch, corn maze, duck races, animal train

Thomasson Family Farm
38223 236th Ave SE, Enumclaw
Pumpkin patch, corn maze, kids korral, tractor train rides, pumpkin sling shot

Tonnemaker Valley Farm, Woodinville Farm Stand
16215 140th Pl NE, Woodinville
You-pick pumpkin patch, you-pick flowers, produce stand, on-site pepper roasting on Saturdays


SNOHOMISH COUNTY

Biringer’s Black Crow Pumpkins & Corn Maze
2431 Highway 530 NE, Arlington
Pumpkin patch, corn maze, straw or hay bale maze, tractor-pulled hay rides, farm market, picnic area

Bob’s Corn & Pumpkin Farm
10917 Elliott Rd, Snohomish
Pumpkin patch, corn maze, bonfire & picnic area, hay rides, pony rides, playground, concessions

Carleton Farm
630 Sunnyside Blvd SE, Lake Stevens
Pumpkin patch, train rides, corn maze, haunted corn maze, tractor-pulled hay rides, farm animals, farm market

Craven Farm
13817 Short School Rd, Snohomish
Pumpkin patch, corn maze, tractor-pulled hay rides, face painting, farm animals, snacks & refreshment stand

The Farm at Swans Trail
7301 Rivershore Rd, Snohomish
Pumpkin patch, corn maze, pick your own apples, pig & duck races, petting zoo, putt-putt golf and more

Fairbank Animal Farm & Pumpkin Patch
15308 52nd Ave W, Edmonds
Pumpkins, petting zoo, farm animals, picnic area

Fosters Pumpkin Farm
5818 State Route 530 NE, Arlington
Pumpkin patch, corn maze, hay bale maze, corn cannon, pre-picked produce, face painting, farm animals, snacks and refreshment stand, picnic area

Stocker Farms
8705 Marsh Rd, Snohomish
Pumpkin patch, corn maze, haunted corn maze, tractor-pulled hay rides, jumping pillow and more

Thomas Family Farm
9010 Marsh Road, Snohomish
Pumpkin patch, corn maze, monster truck rides, haunted house, gem mining, Zombie Safari Paintball Hayride, beer garden, putt-putt golf and more


PIERCE COUNTY

Double R Farms
5820 44th St E, Puyallup
Pumpkin patch, corn maze, hay rides, farm animals, pumpkin sling shot

Maris Farms
25001 Sumner-Buckley Hwy, Buckley
Pumpkin patch, corn maze, haunted woods, farm animals, hay ride, trout fishing, play ground

Picha’s Farm
6502 52nd St E, Puyallup
Pumpkin patch, corn maze, hay ride, pumpkin sling shot, concessions

Scholz Farm
12920 162nd Ave E, Orting
Pumpkin patch, corn maze, play area

Spooner Farms
9622 SR 162 E, Puyallup
Pumpkin patch, farm animals, face painting, pumpkin sling shot, concessions

Community Info July 31, 2019

Matthew Gardner Report – Q2 2019

The following analysis of the Western Washington real estate market is provided by Windermere Real Estate Chief Economist Matthew Gardner. We hope that this information may assist you with making better-informed real estate decisions. For further information about the housing market in your area, please don’t hesitate to contact your Windermere agent.


ECONOMIC OVERVIEW

Washington State employment jumped back up to an annual growth rate of 2.4% following a disappointing slowdown earlier in the spring. As stated in the first quarter Gardner Report, the dismal numbers earlier this year were a function of the state re-benchmarking its data (which they do annually).

The state unemployment rate was 4.7%, marginally up from 4.5% a year ago. My current economic forecast suggests that statewide job growth in 2019 will rise by 2.6%, with a total of 87,500 new jobs created.


HOME SALES

  • There were 22,281 home sales during the second quarter of 2019, representing a drop of 4.8% from the same period in 2018. On a more positive note, sales jumped 67.6% compared to the first quarterof this year.
  • Since the middle of last year, there has been a rapid rise in the number of homes for sale, which is likely the reason sales have slowed. More choice means buyers can be more selective and take their time when choosing a home to buy.
  • Compared to the second quarter of 2018, there were fewer sales in all counties except Whatcom and Lewis. The greatest declines were in Clallam, San Juan, and Jefferson counties.
  • Listings rose 19% compared to the second quarter of 2018, but there are still a number of very tight markets where inventory levels are lower than a year ago. Generally, these are the smaller — and more affordable — markets, which suggests that affordability remains an issue.


HOME PRICES

  • Year-over-year price growth in Western Washington continues to taper. The average home price during second quarter was $540,781, which is 2.8% higher than a year ago. When compared to first quarter of this year, prices were up 12%.
  • Home prices were higher in every county except King, which is unsurprising given the cost of homes in that area. Even though King County is home to the majority of jobs in the region, housing is out of reach for many and I anticipate that this will continue to act as a drag on price growth.
  • When compared to the same period a year ago, price growth was strongest in Lewis County, where home prices were up 15.9%. Double-digit price increases were also seen in Mason, Cowlitz, Grays Harbor, and Skagit counties.
  • The region’s economy remains robust, which should be a positive influence on price growth. That said, affordability issues are pervasive and will act as a headwind through the balance of the year, especially in those markets that are close to job centers. This will likely force some buyers to look further afield when searching for a new home.


DAYS ON MARKET

  • The average number of days it took to sell a home matched the second quarter of 2018.
  • Snohomish County was the tightest market in Western Washington, with homes taking an average of only 21 days to sell. There were five counties where the length of time it took to sell a home dropped compared to the same period a year ago. Market time rose in eight counties and two were unchanged.
  • Across the entire region, it took an average of 41 days to sell a home in the second quarter of 2019. This was the same as a year ago but is down 20 days compared to the first quarter of 2019.
  • As stated above, days-on-market dropped as we moved through the spring, but all markets are not equal. I suggest that this is not too much of an issue and that well-priced homes will continue to attract attention and sell fairly rapidly.


CONCLUSIONS

This speedometer reflects the state of the region’s real estate market using housing inventory, price gains, home sales, interest rates, and larger economic factors. I am leaving the needle in the same position as the first quarter as demand appears to still be strong.

The market has benefitted from a fairly significant drop in mortgage rates. With average 30-year fixed rates still below 4%, I expect buyers who have been sitting on the fence will become more active, especially given that they have more homes to choose from.