|
|
|
|
|
|
|
|
|
|

|
|
|
|
|
|
|
|
|
|


The following analysis of the Western Washington real estate market is provided by Windermere Real Estate Chief Economist Matthew Gardner. We hope that this information may assist you with making better-informed real estate decisions. For further information about the housing market in your area, please don’t hesitate to contact your Windermere agent.
REGIONAL ECONOMIC OVERVIEW
After the COVID-19-induced declines, employment levels in Western Washington continue to rebuild. Interestingly, the state re-benchmarked employment numbers, which showed that the region lost fewer jobs than originally reported. That said, regional employment is still 133,000 jobs lower than during the 2020 peak in February. The return of jobs will continue, but much depends on new COVID-19 infection rates and when the Governor can reopen sections of the economy that are still shut down. Unemployment levels also continue to improve. At the end of the quarter, the unemployment rate was a very respectable 5.5%, down from the peak rate of 16.6% in April. The rate varies across Western Washington, with a low of 4.3% in King County and a high of 9.6% in Grays Harbor County. My current forecast calls for employment levels to continue to improve as we move through the spring. More robust growth won’t happen until a vaccine becomes widely distributed, which is unlikely to happen before the summer.
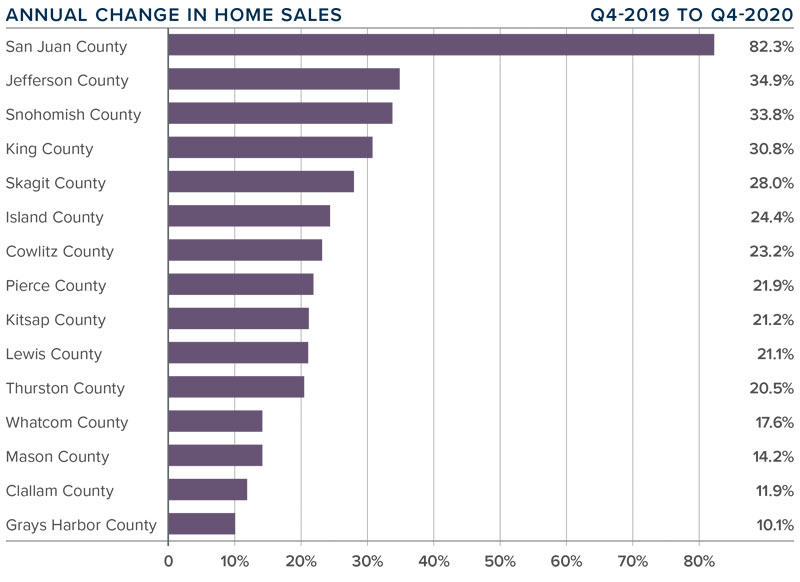
❱ Sales continued to impress, with 23,357 transactions in the quarter. This was an increase of 26.6% from the same period in 2019, but 8.3% lower than in the third quarter of last year, likely due to seasonality.
❱ Listing activity remained very low, even given seasonality. Total available inventory was 37.3% lower than a year ago and 31.2% lower than in the third quarter of 2020.
❱ Sales rose in all counties, with San Juan County seeing the greatest increase. This makes me wonder if buyers are actively looking in more remote markets given ongoing COVID-19 related concerns.
❱ Pending sales—a good gauge of future closings—were 25% higher than a year ago but down 31% compared to the third quarter of 2020. This is unsurprising, given limited inventory and seasonal factors.
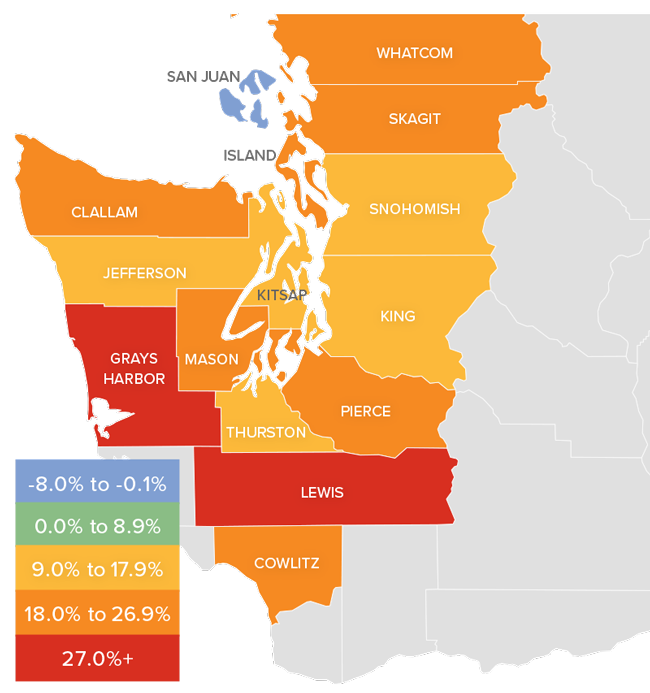
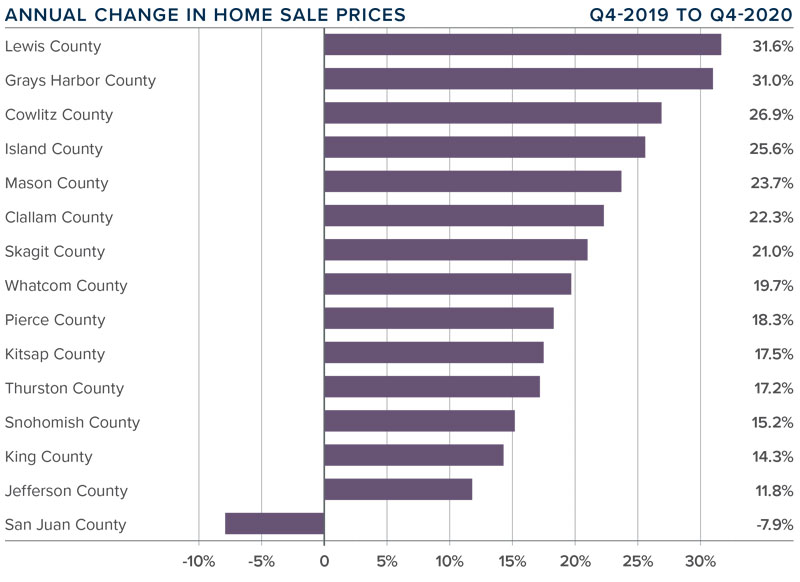
❱ Home price growth in Western Washington continued the trend of above-average appreciation. Prices were up 17.4% compared to a year ago, with an average sale price of $617,475.
❱ Year-over year price growth was strongest in Lewis and Grays Harbor counties. Home prices declined in San Juan County which is notoriously volatile because of its small size.
❱ It is interesting to note that home prices were only 1% higher than third quarter of 2020. Even as mortgage rates continued to drop during the quarter, price growth slowed, and we may well be hitting an affordability ceiling in some markets.
❱ Mortgage rates will stay competitive as we move through 2021, but I expect to see price growth moderate as we run into affordability issues, especially in the more expensive counties.
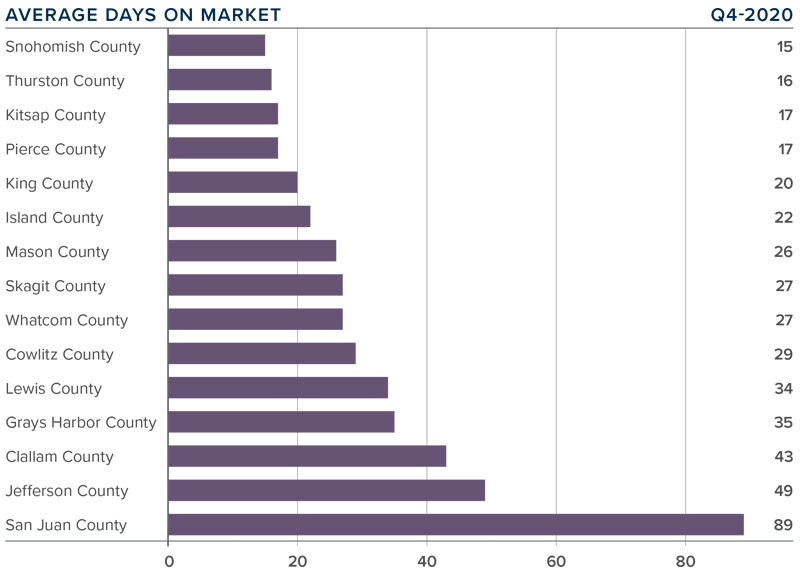
❱ 2020 ended with a flourish as the average number of days it took to sell a home in the final quarter dropped by a very significant 16 days compared to a year ago.
❱ Snohomish County was again the tightest market in Western Washington, with homes taking an average of only 15 days to sell. The only county that saw the length of time it took to sell a home rise compared to the same period a year ago was small Jefferson County, but it was only an increase of four days.
❱ Across the region, it took an average of 31 days to sell a home in the quarter. It is also worth noting that, even as we entered the winter months, it took an average of five fewer days to sell a home than in the third quarter of last year.
❱ The takeaway here is that demand clearly remains strong, and competition for the few homes available to buy continues to push days on market lower.
CONCLUSIONS

This speedometer reflects the state of the region’s real estate market using housing inventory, price gains, home sales, interest rates, and larger economic factors.
Demand has clearly not been impacted by COVID-19, mortgage rates are still very favorable, and limited supply is causing the region’s housing market to remain incredibly active. Because of these conditions, I am moving the needle even further in favor of sellers.
2021 is likely to lead more homeowners to choose to move if they can work from home, which will continue to drive sales growth and should also lead to more inventory. That said, affordability concerns in markets close to Western Washington’s job centers, in combination with modestly rising mortgage rates, should slow the rapid home price appreciation we have seen for several years. I, for one, think that is a good thing.
ABOUT MATTHEW GARDNER

As Chief Economist for Windermere Real Estate, Matthew Gardner is responsible for analyzing and interpreting economic data and its impact on the real estate market on both a local and national level. Matthew has over 30 years of professional experience both in the U.S. and U.K.
In addition to his day-to-day responsibilities, Matthew sits on the Washington State Governors Council of Economic Advisors; chairs the Board of Trustees at the Washington Center for Real Estate Research at the University of Washington; and is an Advisory Board Member at the Runstad Center for Real Estate Studies at the University of Washington where he also lectures in real estate economics.
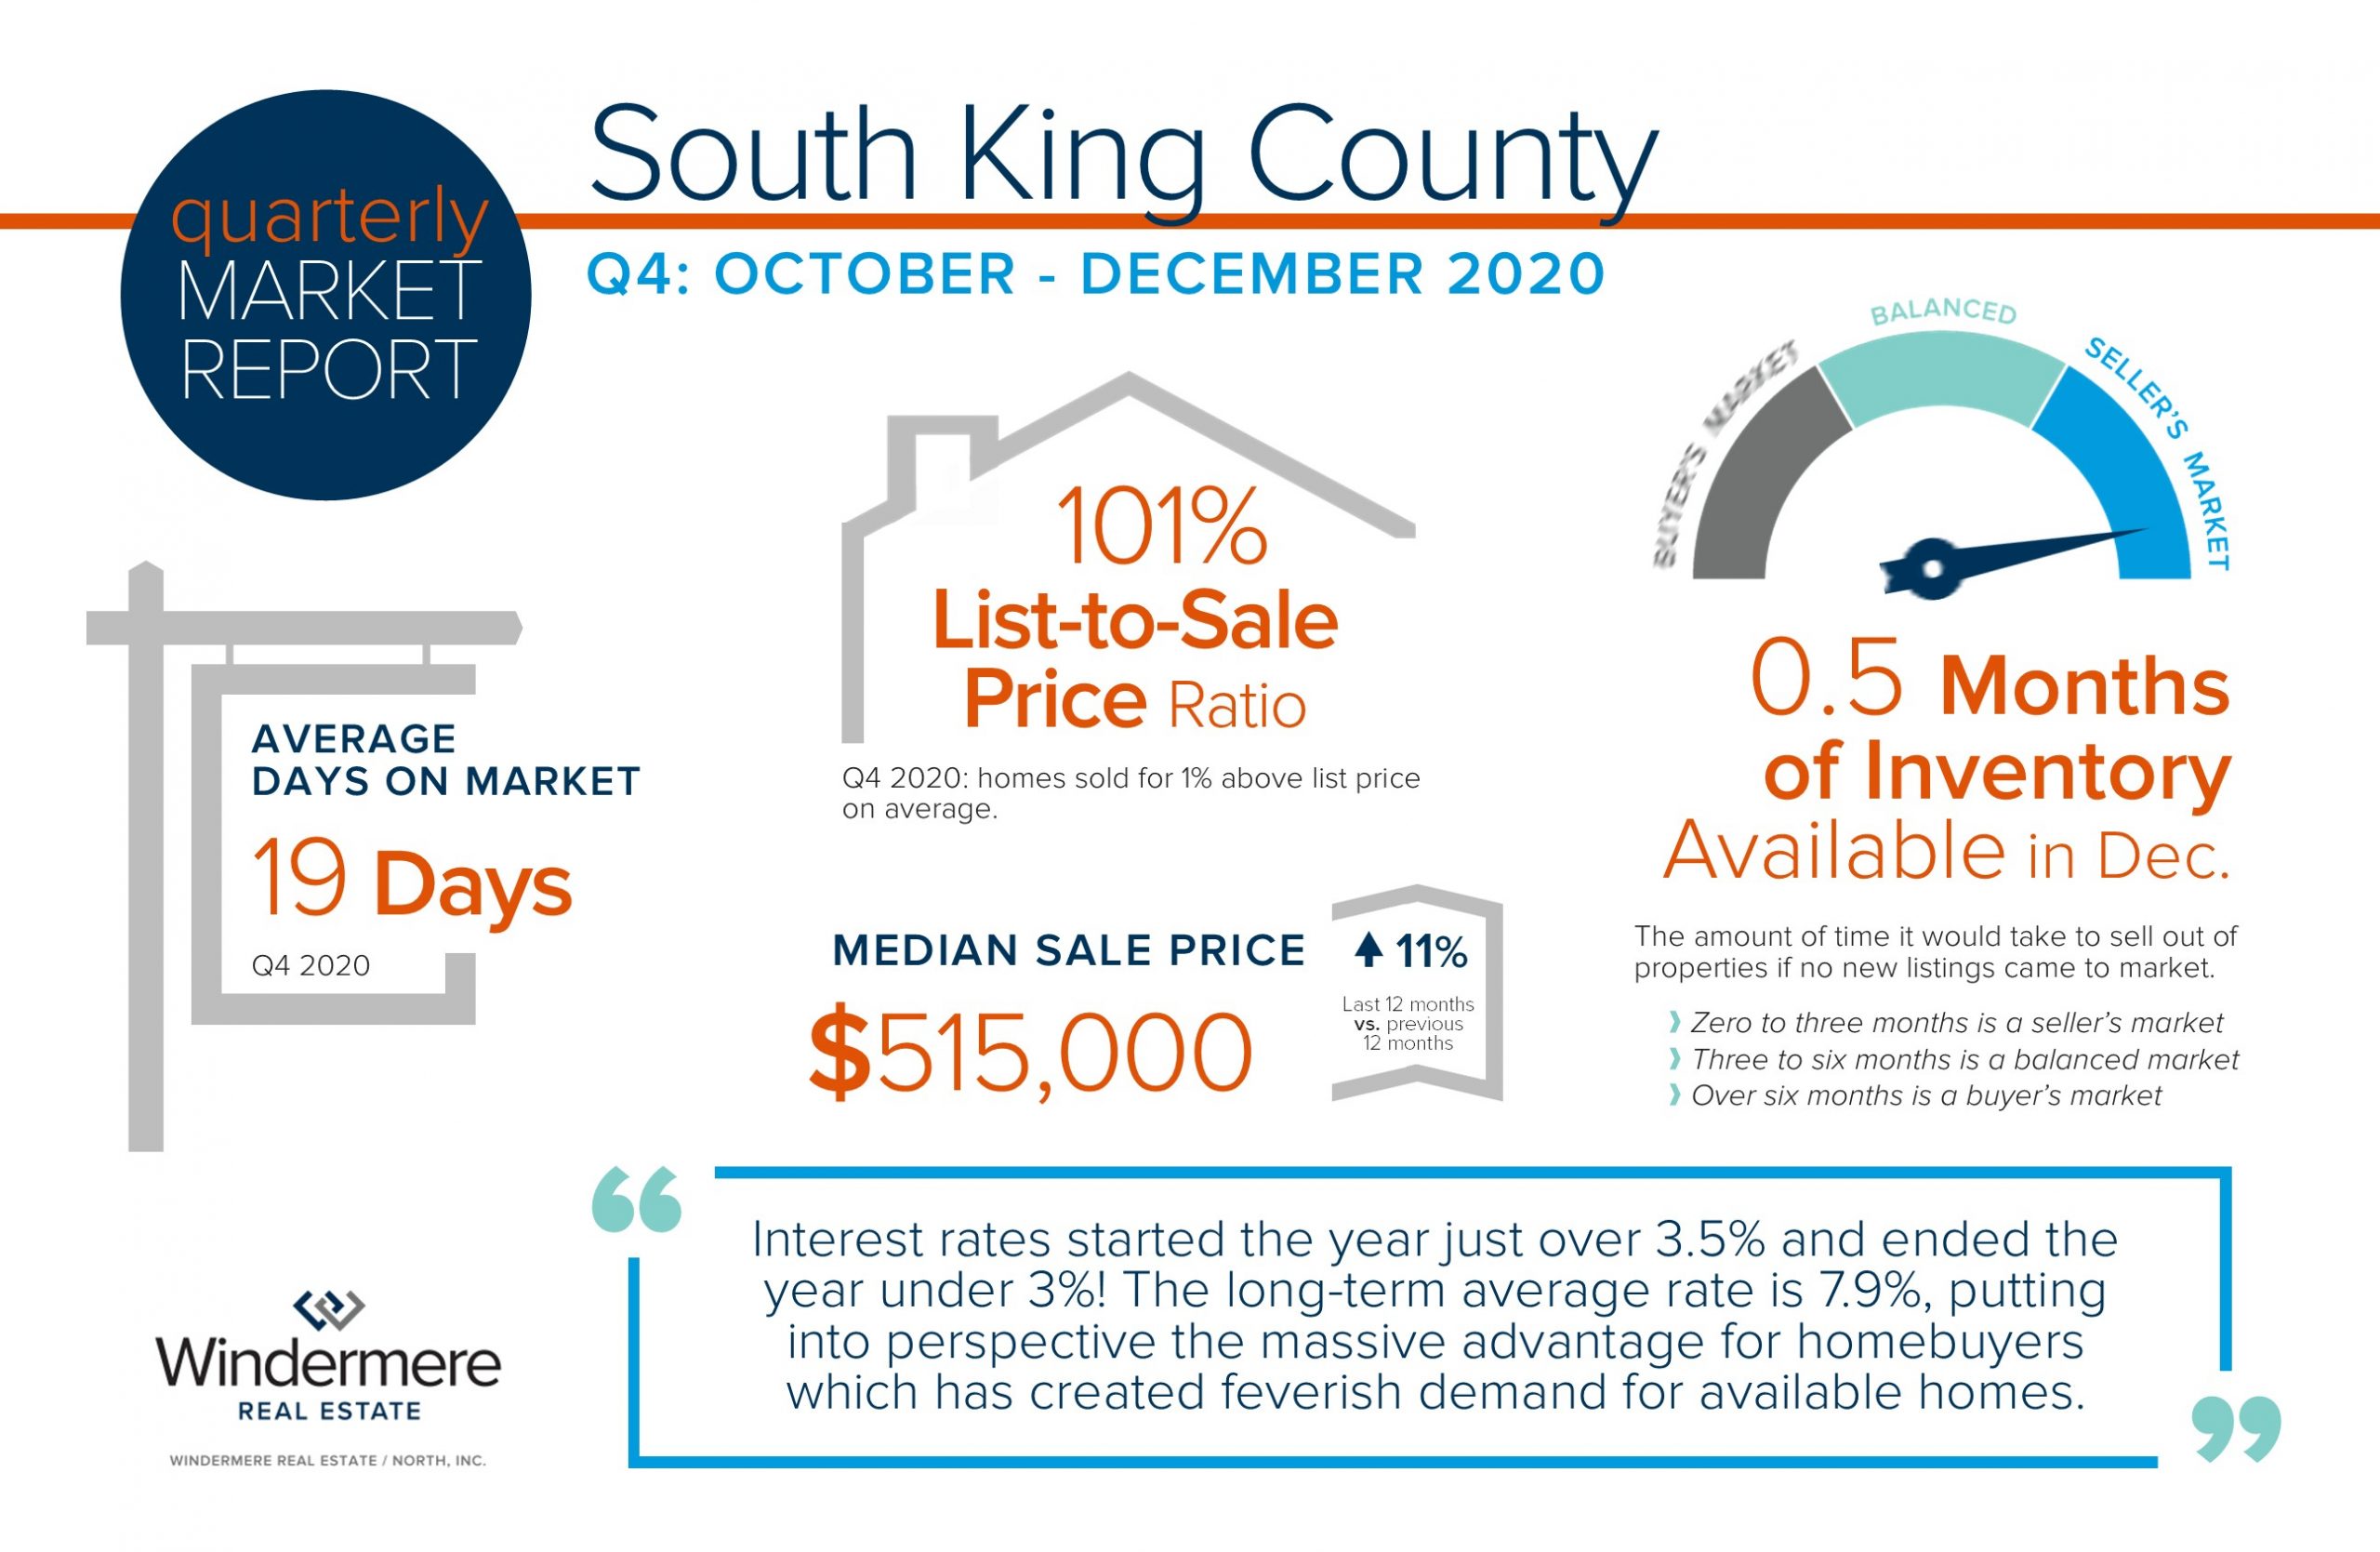
The 2020 real estate market was a bright spot in the economy and the fourth quarter finished strong, with the median price up 11% complete year-over-year. Interest rates started the year just over 3.5% and ended the year under 3%! The long-term average rate is 7.9%, putting into perspective the massive advantage for homebuyers which has created feverish demand for available homes. Even though new listings remained even year-over-year, low interest rates helped drive a 3% increase in closed sales in 2020.
Pandemic-driven moves were spurred by folks working from home, taking early retirement, and in some cas es responding to job loss. Remote working eliminated the need to have a home close to work which encouraged people to flee to the suburbs. Eliminating the commute and the desire for larger spaces with outdoor enjoyment quickly moved to the top of peoples’ wish lists. The last 8 years of positive price growth has led to formidable seller equity, enabling early retirement for some and/or the opportunity to liquidate and recover from the negative effects in some employment industries.
We expect rates to stay low in 2021 and with many Millennials coming of age there will continue to be large amounts of homebuyers eagerly waiting for fresh inventory. Ending the year at 0.5 months of inventory is essentially ground zero for selection, putting home sellers in the driver’s seat for now. I will continue to keep you updated throughout 2021 as we navigate these unique times. It is my goal to help keep my clients informed and empower strong decisions; please reach out if I can help.
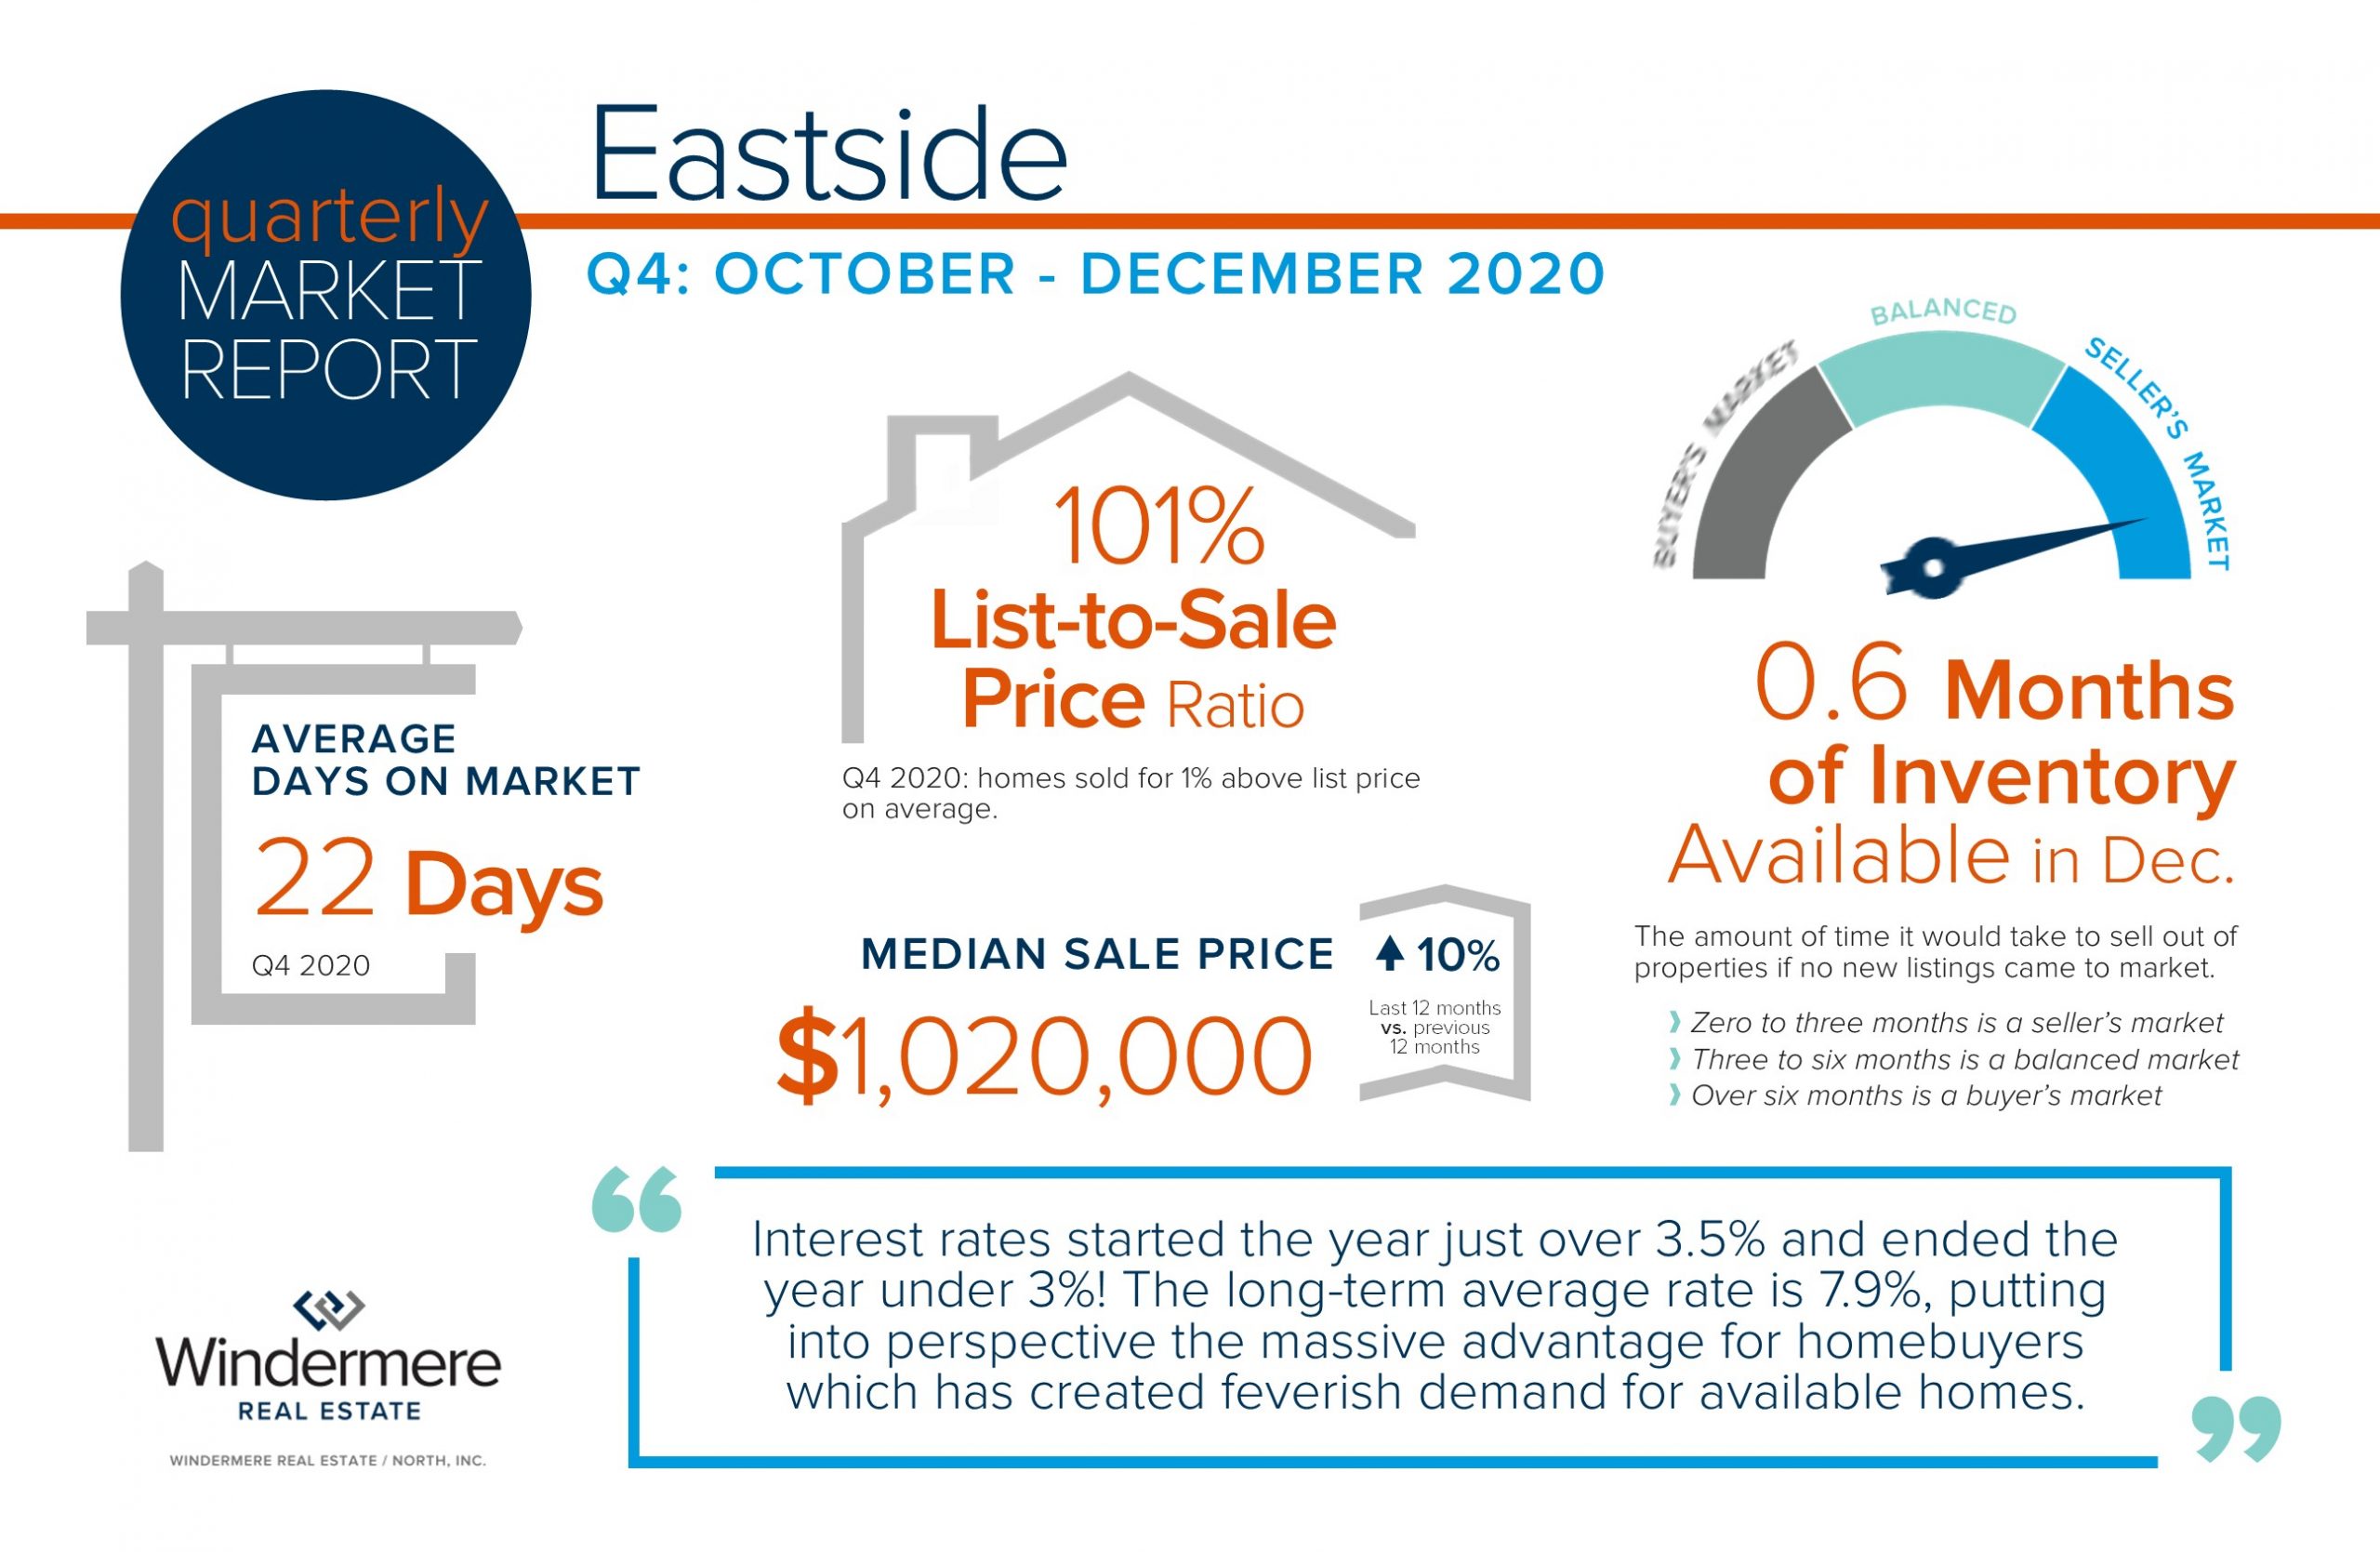
The 2020 real estate market was a bright spot in the economy and the fourth quarter finished strong, with the median price up 10% complete year-over-year. Interest rates started the year just over 3.5% and ended the year under 3%! The long-term average rate is 7.9%, putting into perspective the massive advantage for homebuyers which has created feverish demand for available homes. Even though new listings were down by 6% in 2020, low interest rates helped drive a 3% increase in closed sales.
Pandemic-driven moves were spurred by folks working from home, taking early retirement, and in some cases responding to job loss. Remote working eliminated the need to have a home close to work which encouraged people to flee to the suburbs. Eliminating the commute and the desire for larger spaces with outdoor enjoyment quickly moved to the top of peoples’ wish lists. The last 8 years of positive price growth has led to formidable seller equity, enabling early retirement for some and/or the opportunity to liquidate and recover from the negative effects in some employment industries.
We expect rates to stay low in 2021 and with many Millennials coming of age there will continue to be large amounts of homebuyers eagerly waiting for fresh inventory. Ending the year at 0.6 months of inventory is essentially ground zero for selection, putting home sellers in the driver’s seat for now. I will continue to keep you updated throughout 2021 as we navigate these unique times. It is my goal to help keep my clients informed and empower strong decisions; please reach out if I can help.

The 2020 real estate market was a bright spot in the economy and the fourth quarter finished strong, with the median price up 6% complete year-over-year. Interest rates started the year just over 3.5% and ended the year under 3%! The long-term average rate is 7.9%, putting into perspective the massive advantage for homebuyers which has created feverish demand for available homes. Even though new listings were up 8% in 2020, low interest rates helped drive a 12% increase in closed sales.
Pandemic-driven moves were spurred by folks working from home, taking early retirement, and in some cases responding to job loss. Remote working eliminated the need to have a home close to work which encouraged people to flee to the suburbs. Eliminating the commute and the desire for larger spaces with outdoor enjoyment quickly moved to the top of peoples’ wish lists. The last 8 years of positive price growth has led to formidable seller equity, enabling early retirement for some and/or the opportunity to liquidate and recover from the negative effects in some employment industries.
We expect rates to stay low in 2021 and with many Millennials coming of age there will continue to be large amounts of homebuyers eagerly waiting for fresh inventory. Ending the year at one month of inventory is essentially ground zero for selection, putting home sellers in the driver’s seat for now. I will continue to keep you updated throughout 2021 as we navigate these unique times. It is my goal to help keep my clients informed and empower strong decisions; please reach out if I can help.
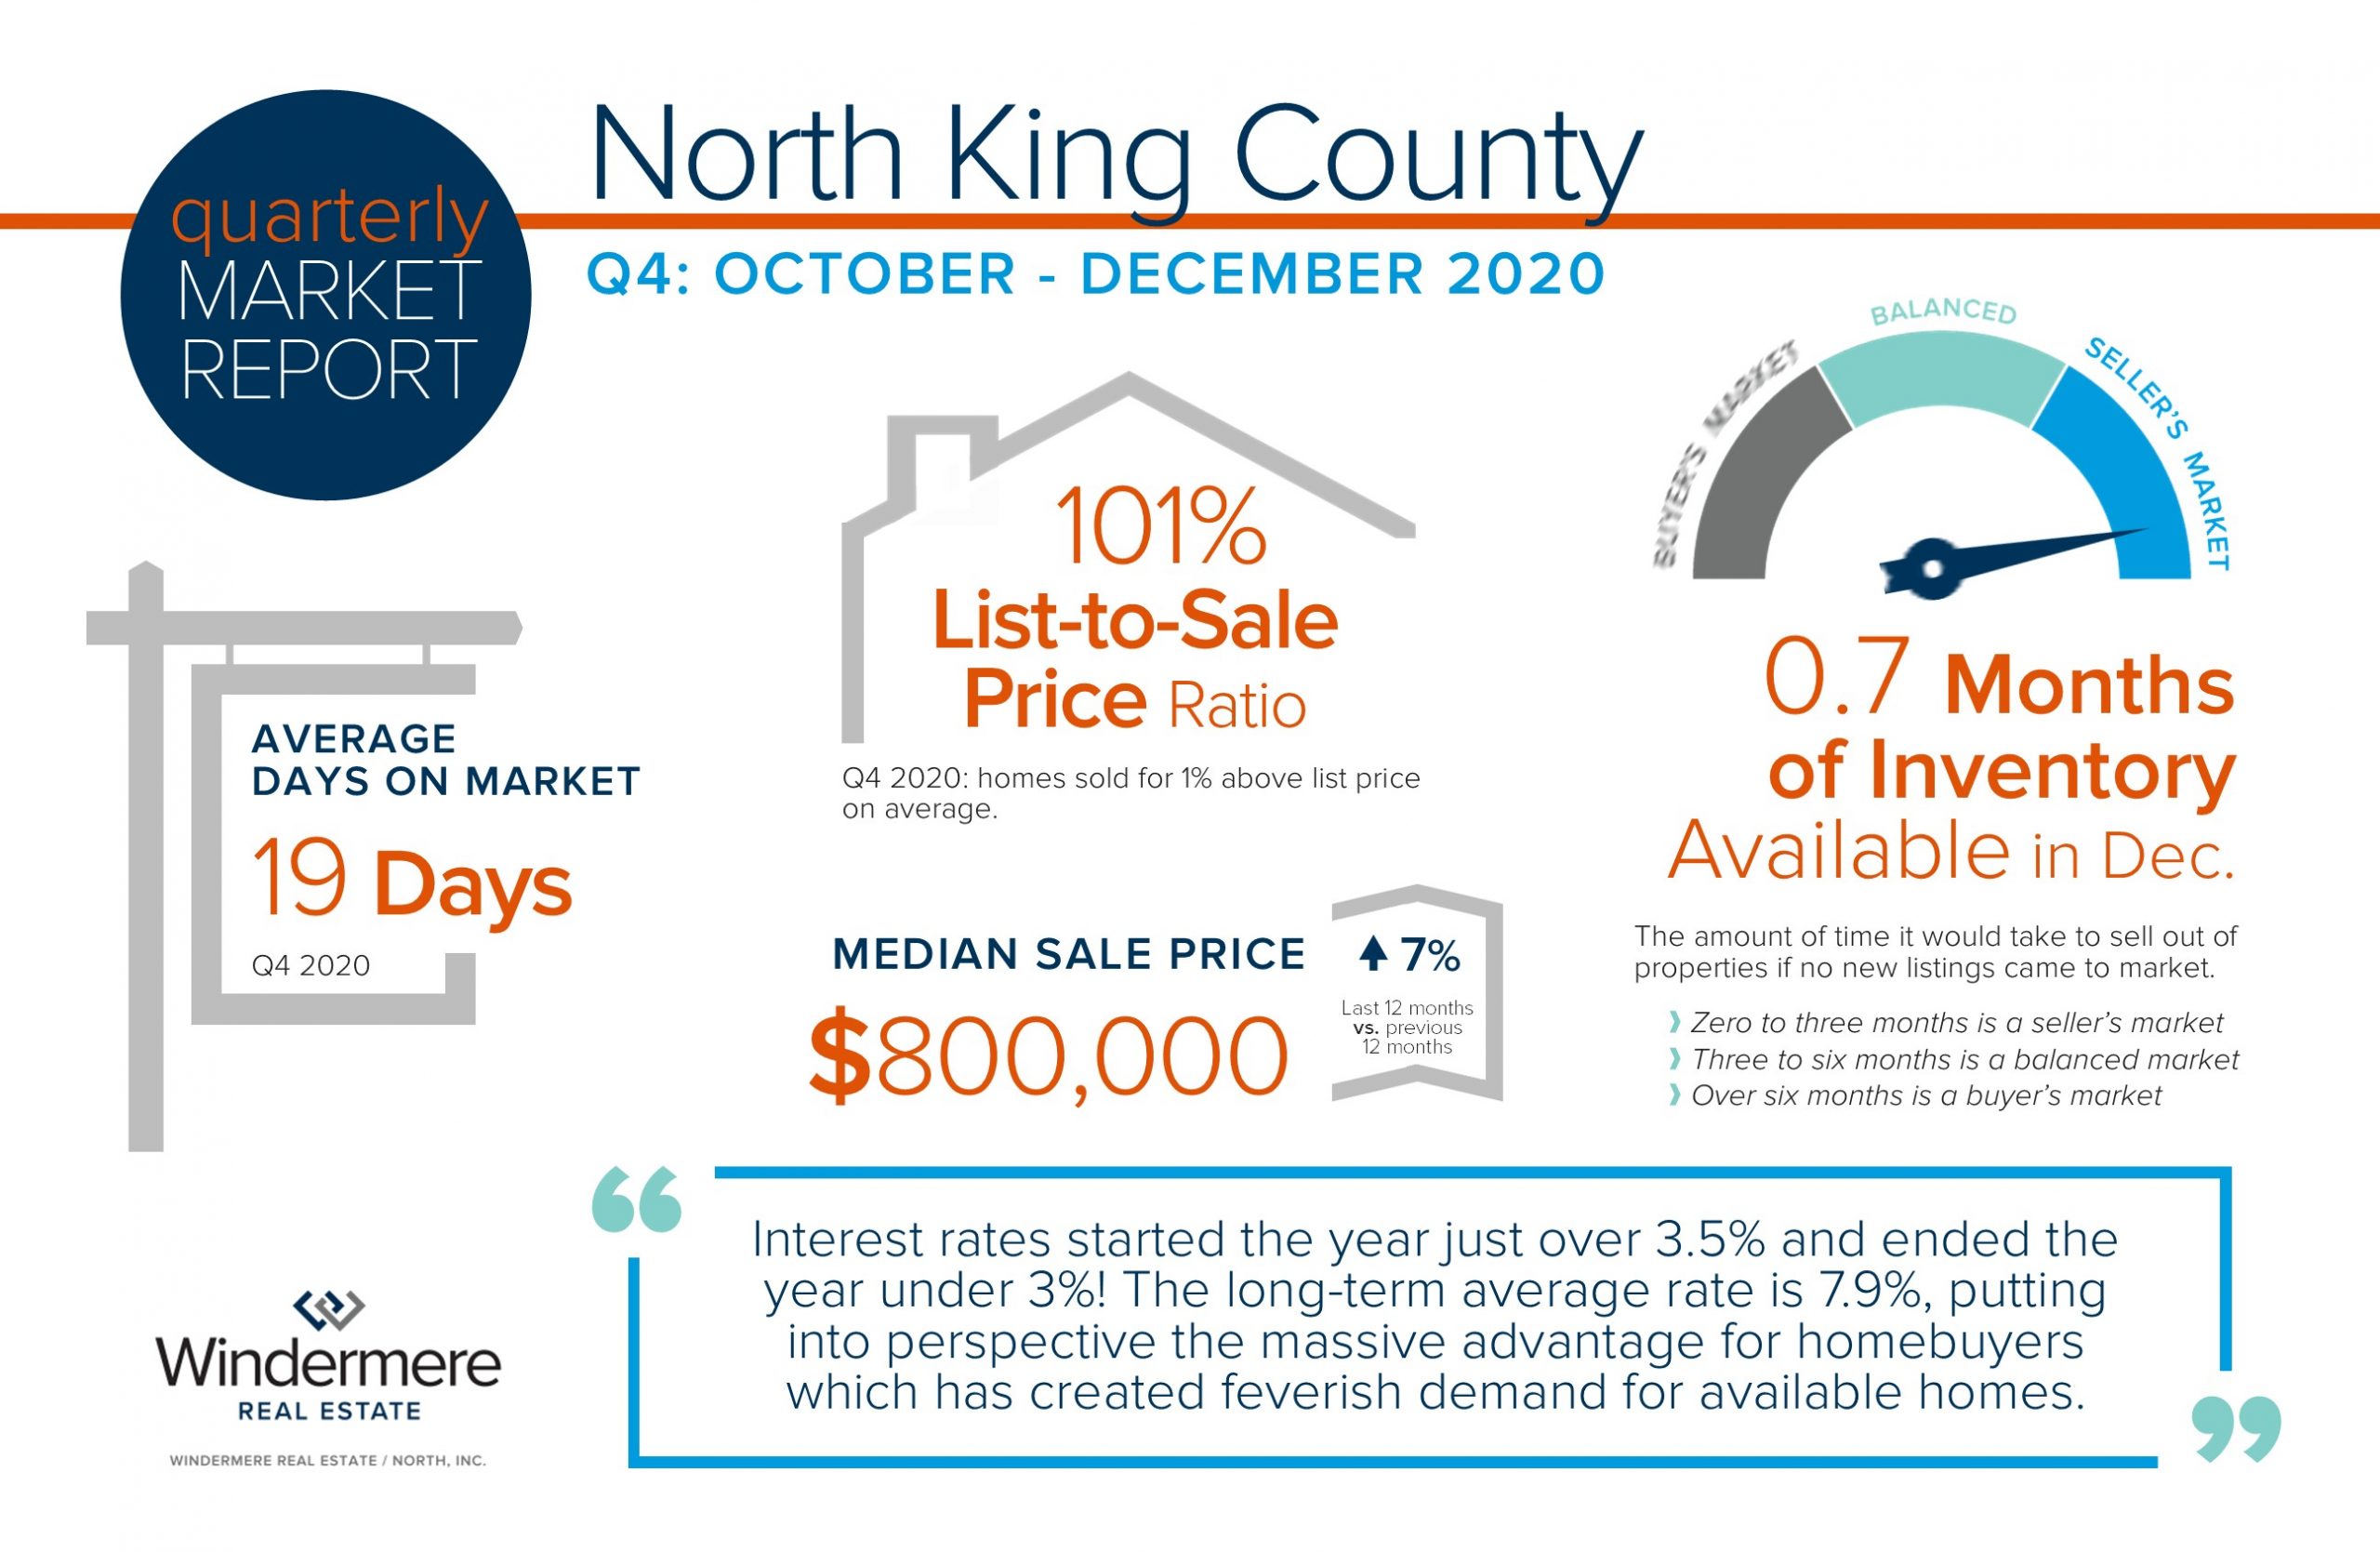
The 2020 real estate market was a bright spot in the economy and the fourth quarter finished strong, with the median price up 7% complete year-over-year. Interest rates started the year just over 3.5% and ended the year under 3%! The long-term average rate is 7.9%, putting into perspective the massive advantage for homebuyers which has created feverish demand for available homes. Even though new listings remained even year-over-year, low interest rates helped drive a 7% increase in closed sales in 2020.
Pandemic-driven moves were spurred by folks working from home, taking early retirement, and in some  cases responding to job loss. Remote working eliminated the need to have a home close to work which encouraged people to flee to the suburbs. Eliminating the commute and the desire for larger spaces with outdoor enjoyment quickly moved to the top of peoples’ wish lists. The last 8 years of positive price growth has led to formidable seller equity, enabling early retirement for some and/or the opportunity to liquidate and recover from the negative effects in some employment industries.
We expect rates to stay low in 2021 and with many Millennials coming of age there will continue to be large amounts of homebuyers eagerly waiting for fresh inventory. Ending the year at 0.7 months of inventory is essentially ground zero for selection, putting home sellers in the driver’s seat for now. I will continue to keep you updated throughout 2021 as we navigate these unique times. It is my goal to help keep my clients informed and empower strong decisions; please reach out if I can help.
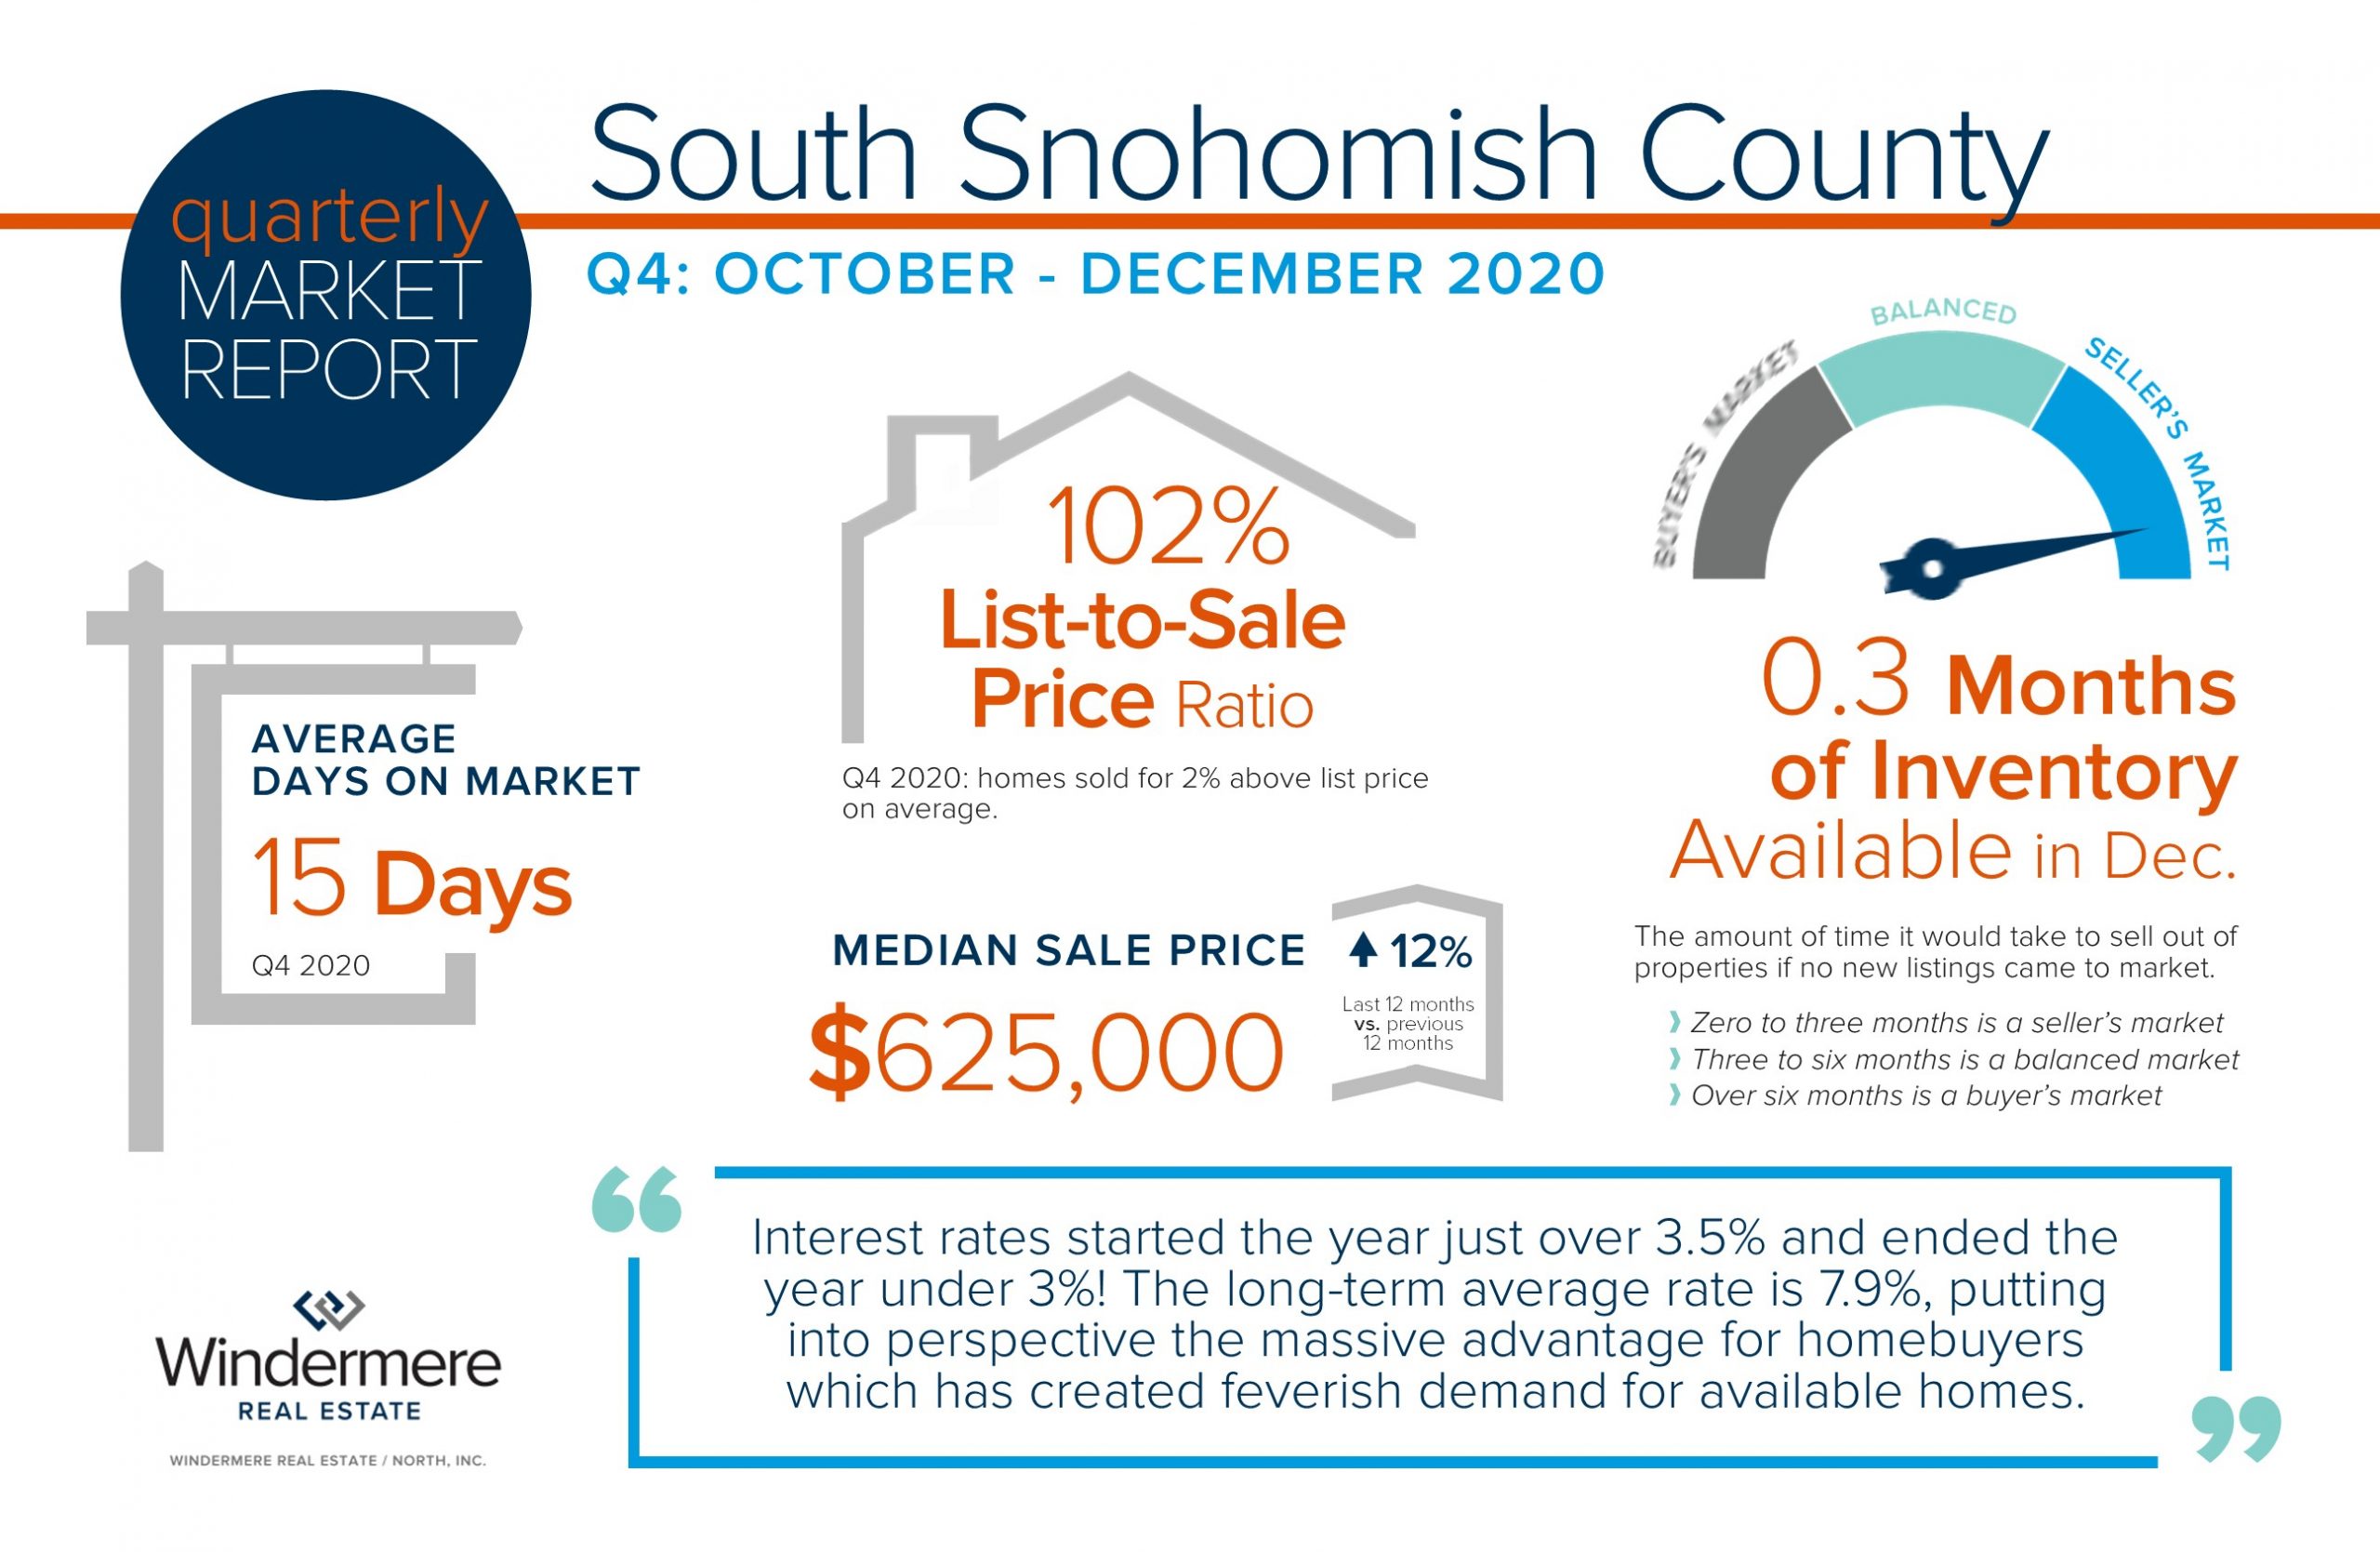
The 2020 real estate market was a bright spot in the economy and the fourth quarter finished strong, with the median price up 12% complete year-over-year. Interest rates started the year just over 3.5% and ended the year under 3%! The long-term average rate is 7.9%, putting into perspective the massive advantage for homebuyers which has created feverish demand for available homes. Even though new listings were down by 6% in 2020, low interest rates helped drive a 3% increase in closed sales.
Pandemic-driven moves were spurred by folks working from home, taking early retirement, and in some cases responding to job loss. Remote working eliminated the need to have a home close to work which encouraged people to flee to the suburbs. Eliminating the commute and the desire for larger spaces with outdoor enjoyment quickly moved to the top of peoples’ wish lists. The last 8 years of positive price growth has led to formidable seller equity, enabling early retirement for some and/or the opportunity to liquidate and recover from the negative effects in some employment industries.
We expect rates to stay low in 2021 and with many Millennials coming of age there will continue to be large amounts of homebuyers eagerly waiting for fresh inventory. Ending the year at 0.3 months of inventory is essentially ground zero for selection, putting home sellers in the driver’s seat for now. I will continue to keep you updated throughout 2021 as we navigate these unique times. It is my goal to help keep my clients informed and empower strong decisions; please reach out if I can help.
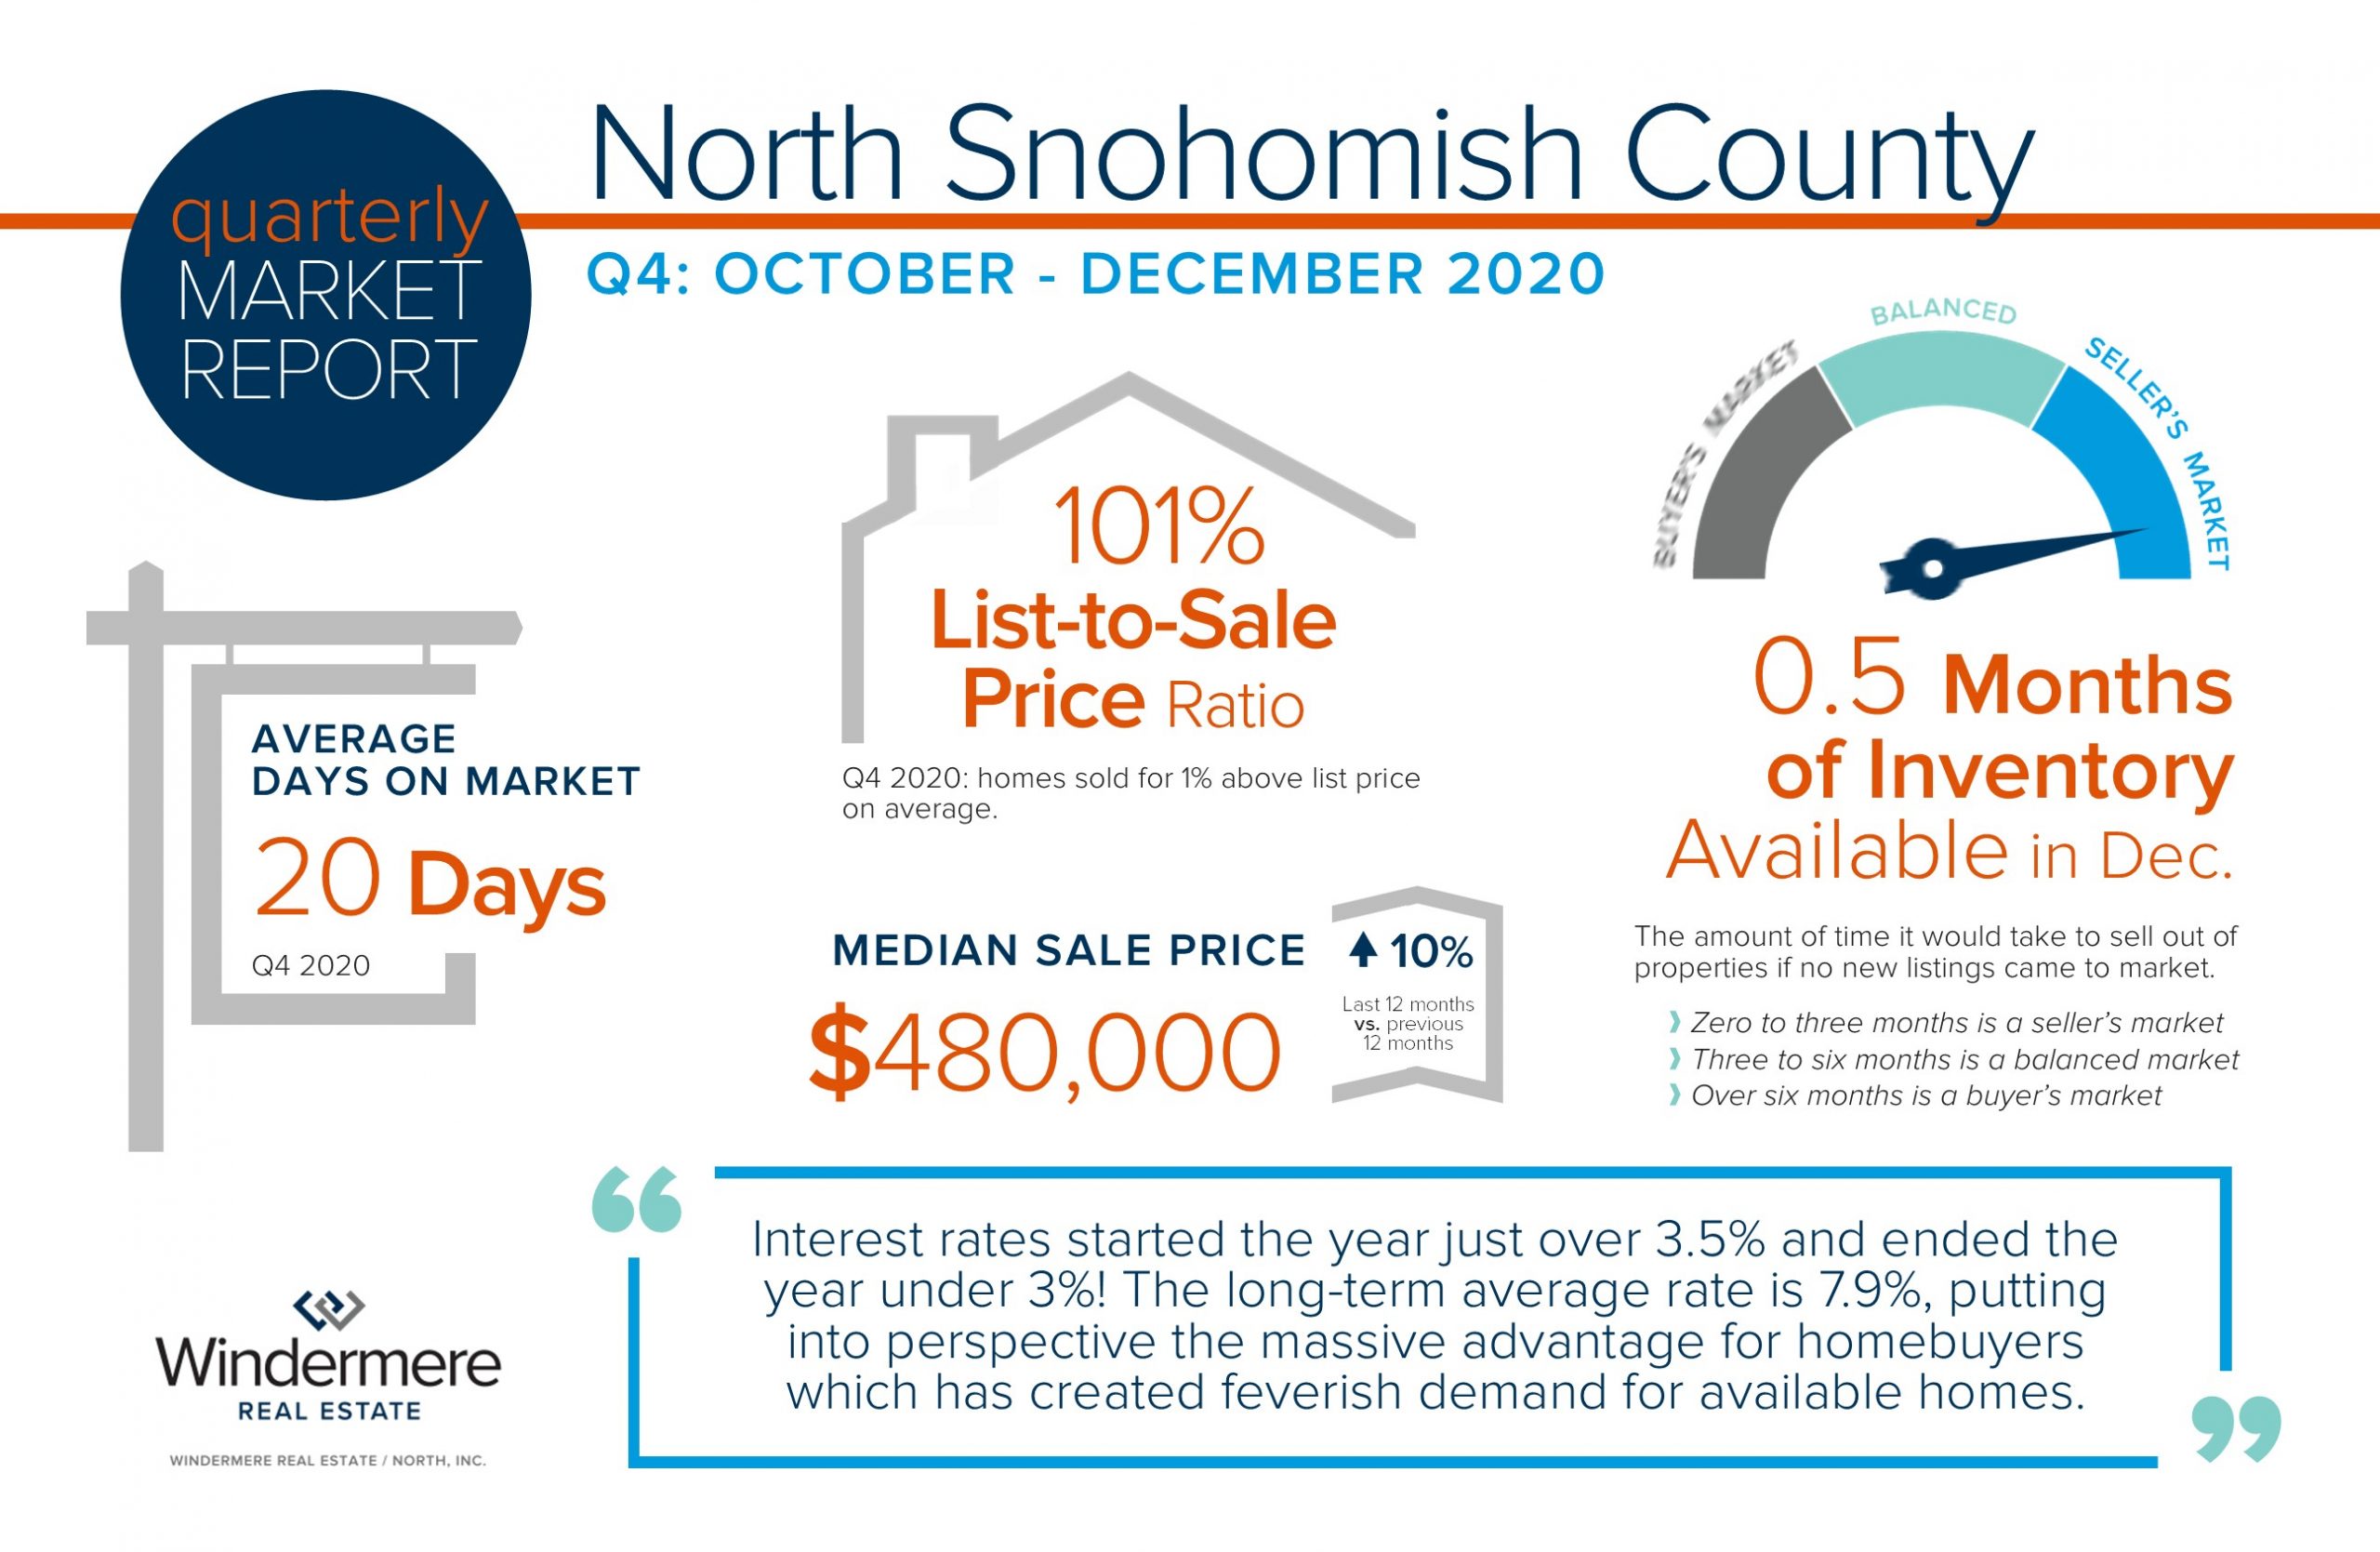
The 2020 real estate market was a bright spot in the economy and the fourth quarter finished strong, with the median price up 10% complete year-over-year. Interest rates started the year just over 3.5% and ended the year under 3%! The long-term average rate is 7.9%, putting into perspective the massive advantage for homebuyers which has created feverish demand for available homes. Even though new listings remained even year-over-year, low interest rates helped drive an 8% increase in closed sale s in 2020.
Pandemic-driven moves were spurred by folks working from home, taking early retirement, and in some cases responding to job loss. Remote working eliminated the need to have a home close to work which encouraged people to flee to the suburbs. Eliminating the commute and the desire for larger spaces with outdoor enjoyment quickly moved to the top of peoples’ wish lists. The last 8 years of positive price growth has led to formidable seller equity, enabling early retirement for some and/or the opportunity to liquidate and recover from the negative effects in some employment industries.
We expect rates to stay low in 2021 and with many Millennials coming of age there will continue to be large amounts of homebuyers eagerly waiting for fresh inventory. Ending the year at 0.5 months of inventory is essentially ground zero for selection, putting home sellers in the driver’s seat for now. I will continue to keep you updated throughout 2021 as we navigate these unique times. It is my goal to help keep my clients informed and empower strong decisions; please reach out if I can help.