As Chief Economist for Windermere Real Estate, Matthew Gardner is responsible for analyzing and interpreting economic data. With over 30 years of professional experience, he provides valuable insights into the real estate industry and housing market, including quarterly regional reports, monthly videos, and timely analysis of the latest trends. Below the Top 10, you will find information inviting you to the live, virtual Economic Forecast Event I am hosting in January. Please reach out if you would like to attend.
1. Still no housing bubble
This was number one on my list last year and, so far, my forecast was spot on. The reason why I’m calling it out again is because the market performed better in 2023 than I expected. Continued price growth, combined with significantly higher mortgage rates, might suggest to some that the market will implode in 2024, but I find this implausible.
2. Mortgage rates will drop, but not quickly
The U.S. economy has been remarkably resilient, which has led the Federal Reserve to indicate that they will keep mortgage rates higher for longer to tame inflation. But data shows inflation and the broader economy are starting to slow, which should allow mortgage rates to ease in 2024. That said, I think rates will only fall to around 6% by the end of the year.
3. Listing activity will rise modestly
Although I expect a modest increase in listing activity in 2024, many homeowners will be hesitant to sell and lose their current mortgage rate. The latest data shows 80% of mortgaged homeowners in the U.S. have rates at or below 5%. Although they may not be inclined to sell right now, when rates fall to within 1.5% of their current rate, some will be motivated to move.
4. Home prices will rise, but not much
While many forecasters said home prices would fall in 2023, that was not the case, as the lack of inventory propped up home values. Given that it’s unlikely that there will be a significant increase in the number of homes for sale, I don’t expect prices to drop in 2024. However, growth will be a very modest 1%, which is the lowest pace seen for many years, but growth all the same.
5. Home values in markets that crashed will recover
During the pandemic, there were a number of more affordable markets across the country that experienced significant price increases, followed by price declines post-pandemic. I expected home prices in those areas to take longer to recover than the rest of the nation, but I’m surprised by how quickly they have started to grow, with most markets having either matched their historic highs or getting close to it – even in the face of very high borrowing costs. In 2024, I expect prices to match or exceed their 2022 highs in the vast majority of metro areas across the country.
6. New construction will gain market share
Although new construction remains tepid, builders are benefiting from the lack of supply in the resale market and are taking a greater share of listings. While this might sound like a positive for builders, it’s coming at a cost through lower list prices and increased incentives such as mortgage rate buy-downs. Although material costs have softened, it will remain very hard for builders to deliver enough housing to meet the demand.
7. Housing affordability will get worse
With home prices continuing to rise and the pace of borrowing costs far exceeding income growth, affordability will likely erode further in 2024. For affordability to improve, it would require either a significant drop in home values, a significant drop in mortgage rates, a significant increase in household incomes, or some combination of the three. But I’m afraid this is very unlikely. First-time home buyers will be the hardest hit by this continued lack of affordable housing.
8. Government needs to continue taking housing seriously
The government has started to take housing and affordability more seriously, with several states already having adopted new land use policies aimed at releasing developable land. In 2024, I hope cities and counties will continue to ease their restrictive land use policies. I also hope they’ll continue to streamline the permitting process and reduce the fees that are charged to builders, as these costs are passed directly onto the home buyer, which further impacts affordability.
9. Foreclosure activity won’t impact the market
Many expected that the end of forbearance would bring a veritable tsunami of homes to market, but that didn’t happen. At its peak, almost 1-in-10 homes in America were in the program, but that has fallen to below 1%. That said, foreclosure starts have picked up, but still remain well below pre-pandemic levels. Look for delinquency levels to continue rising in 2024, but they will only be returning to the long-term average and are not a cause for concern.
10. Sales will rise but remain the lowest in 15 years
2023 will likely be remembered as the year when home sales were the lowest since the housing bubble burst in 2008. I expect the number of homes for sale to improve modestly in 2024 which, combined with mortgage rates trending lower, should result in about 4.4 million home sales. Ultimately though, demand exceeding supply will mean that sellers will still have the upper hand.

 Facebook
 X
X
 Pinterest
 Copy Link


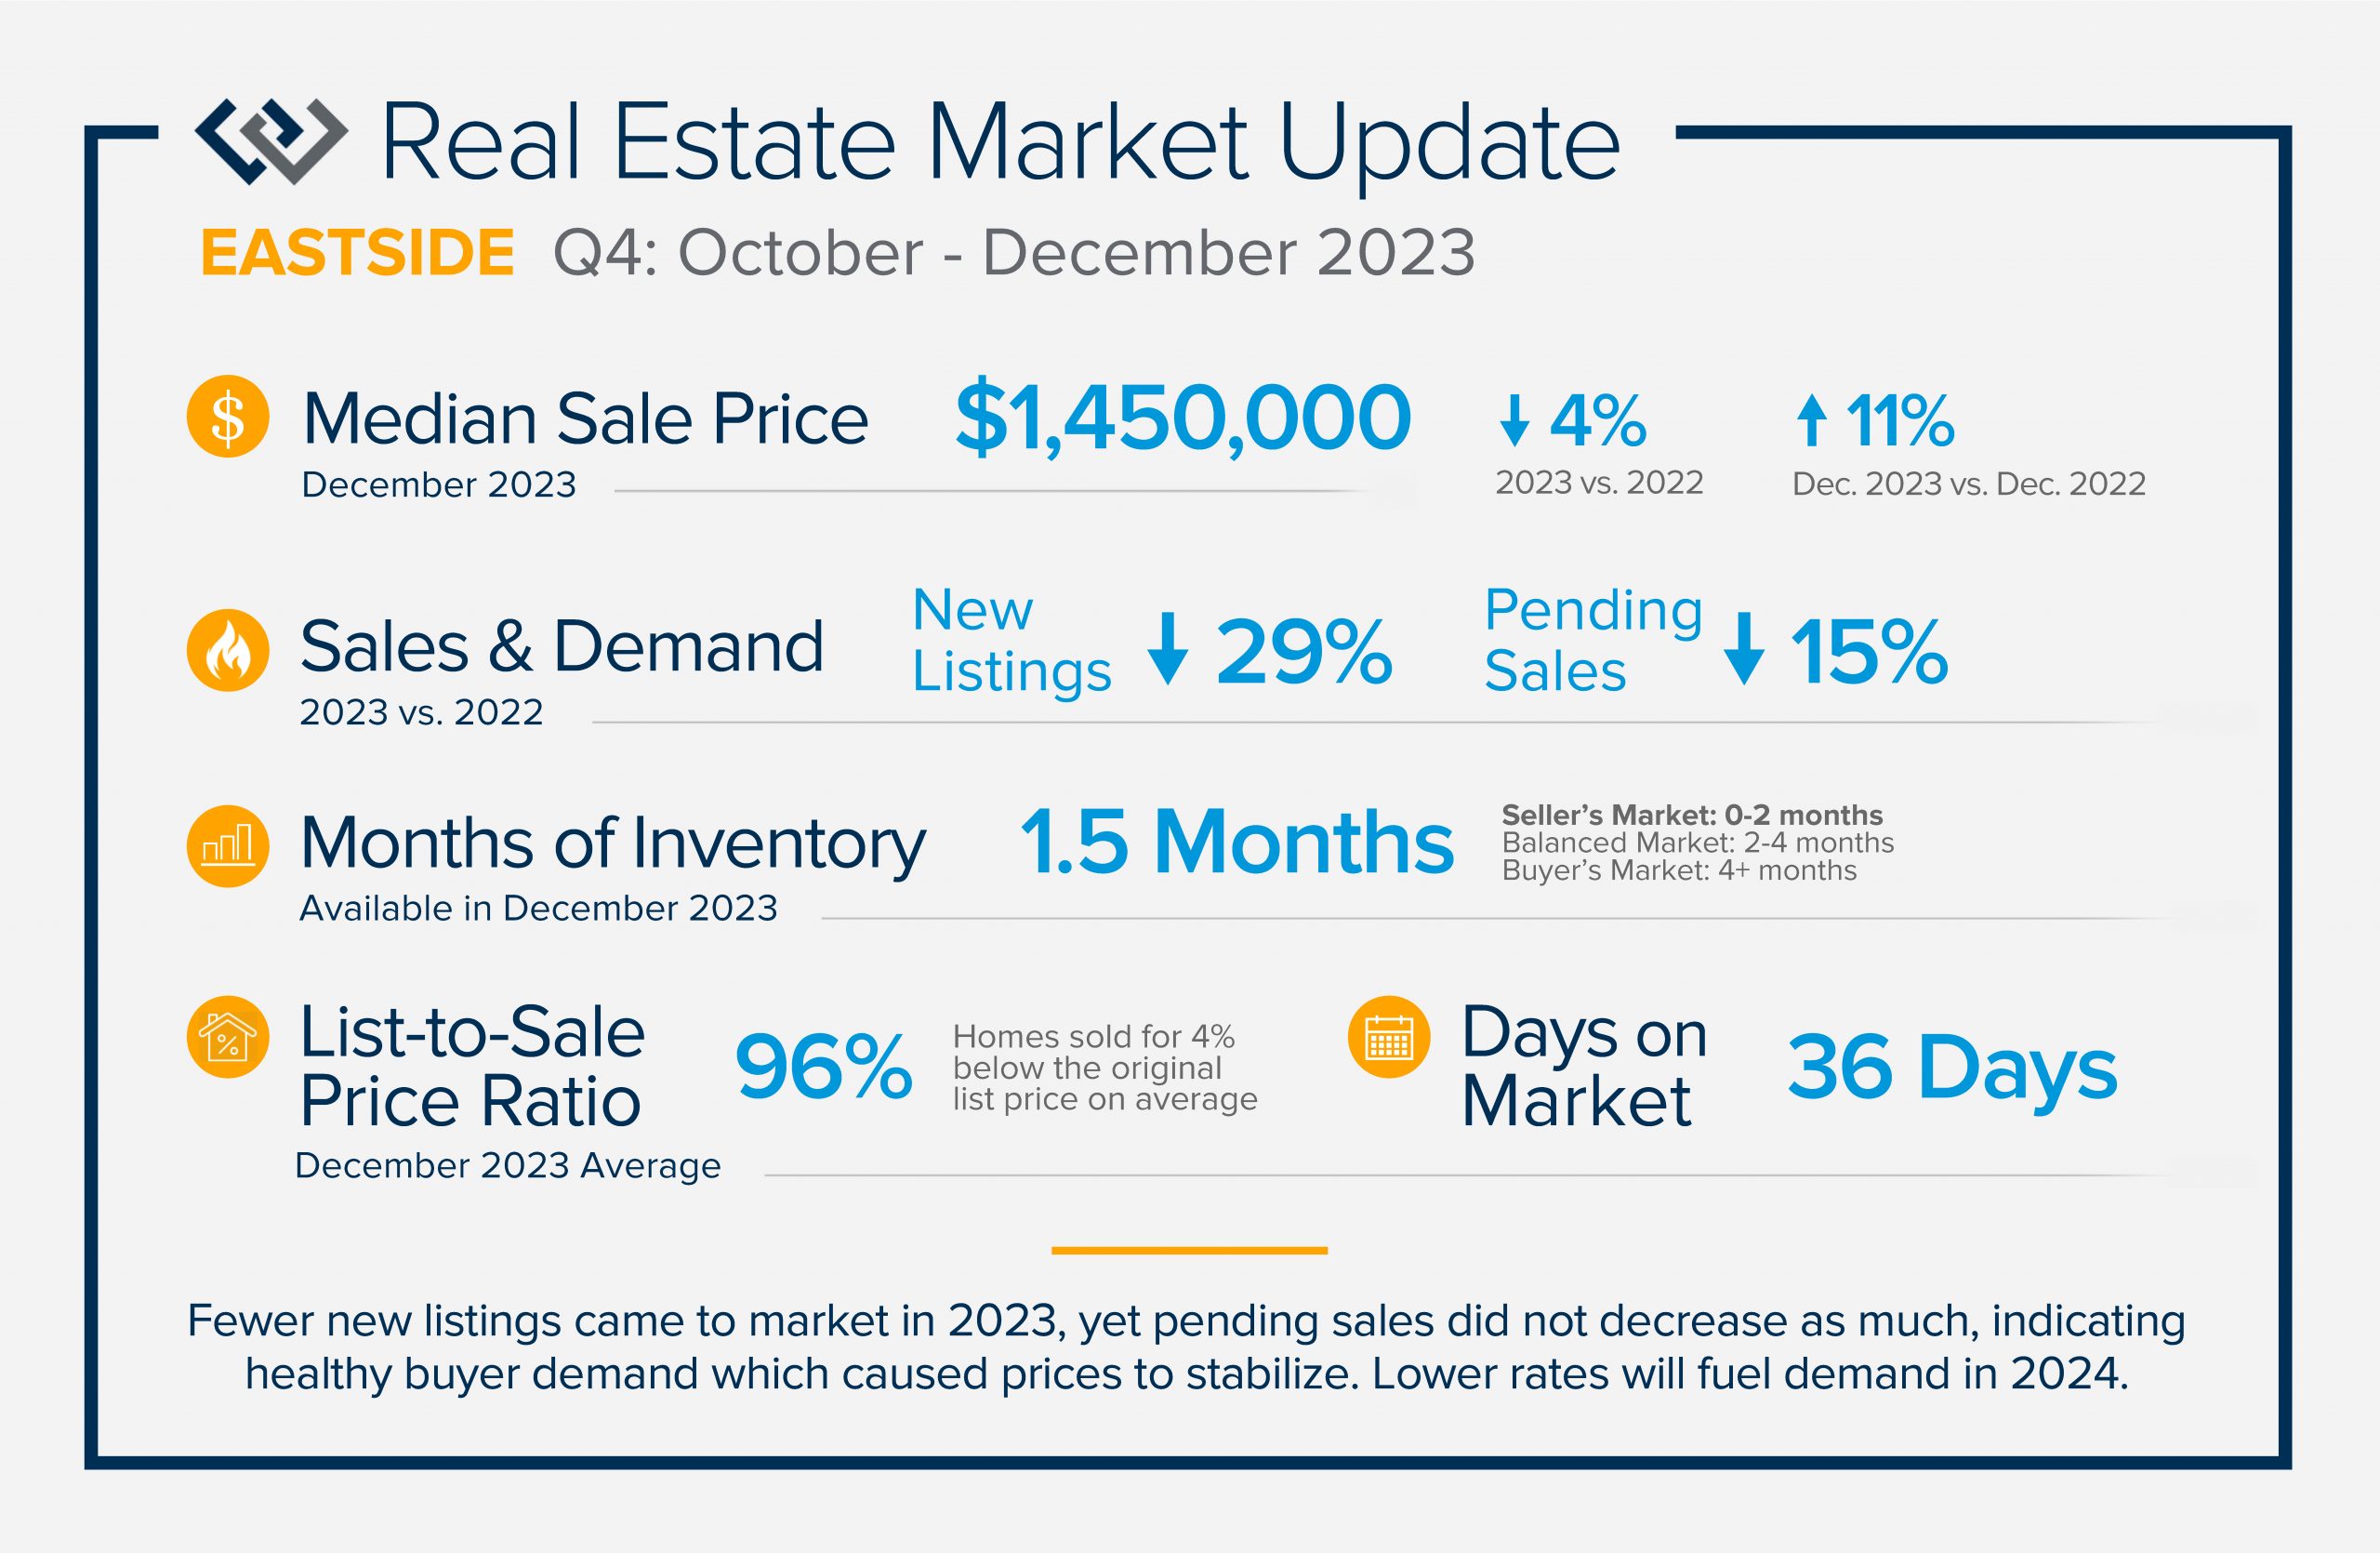
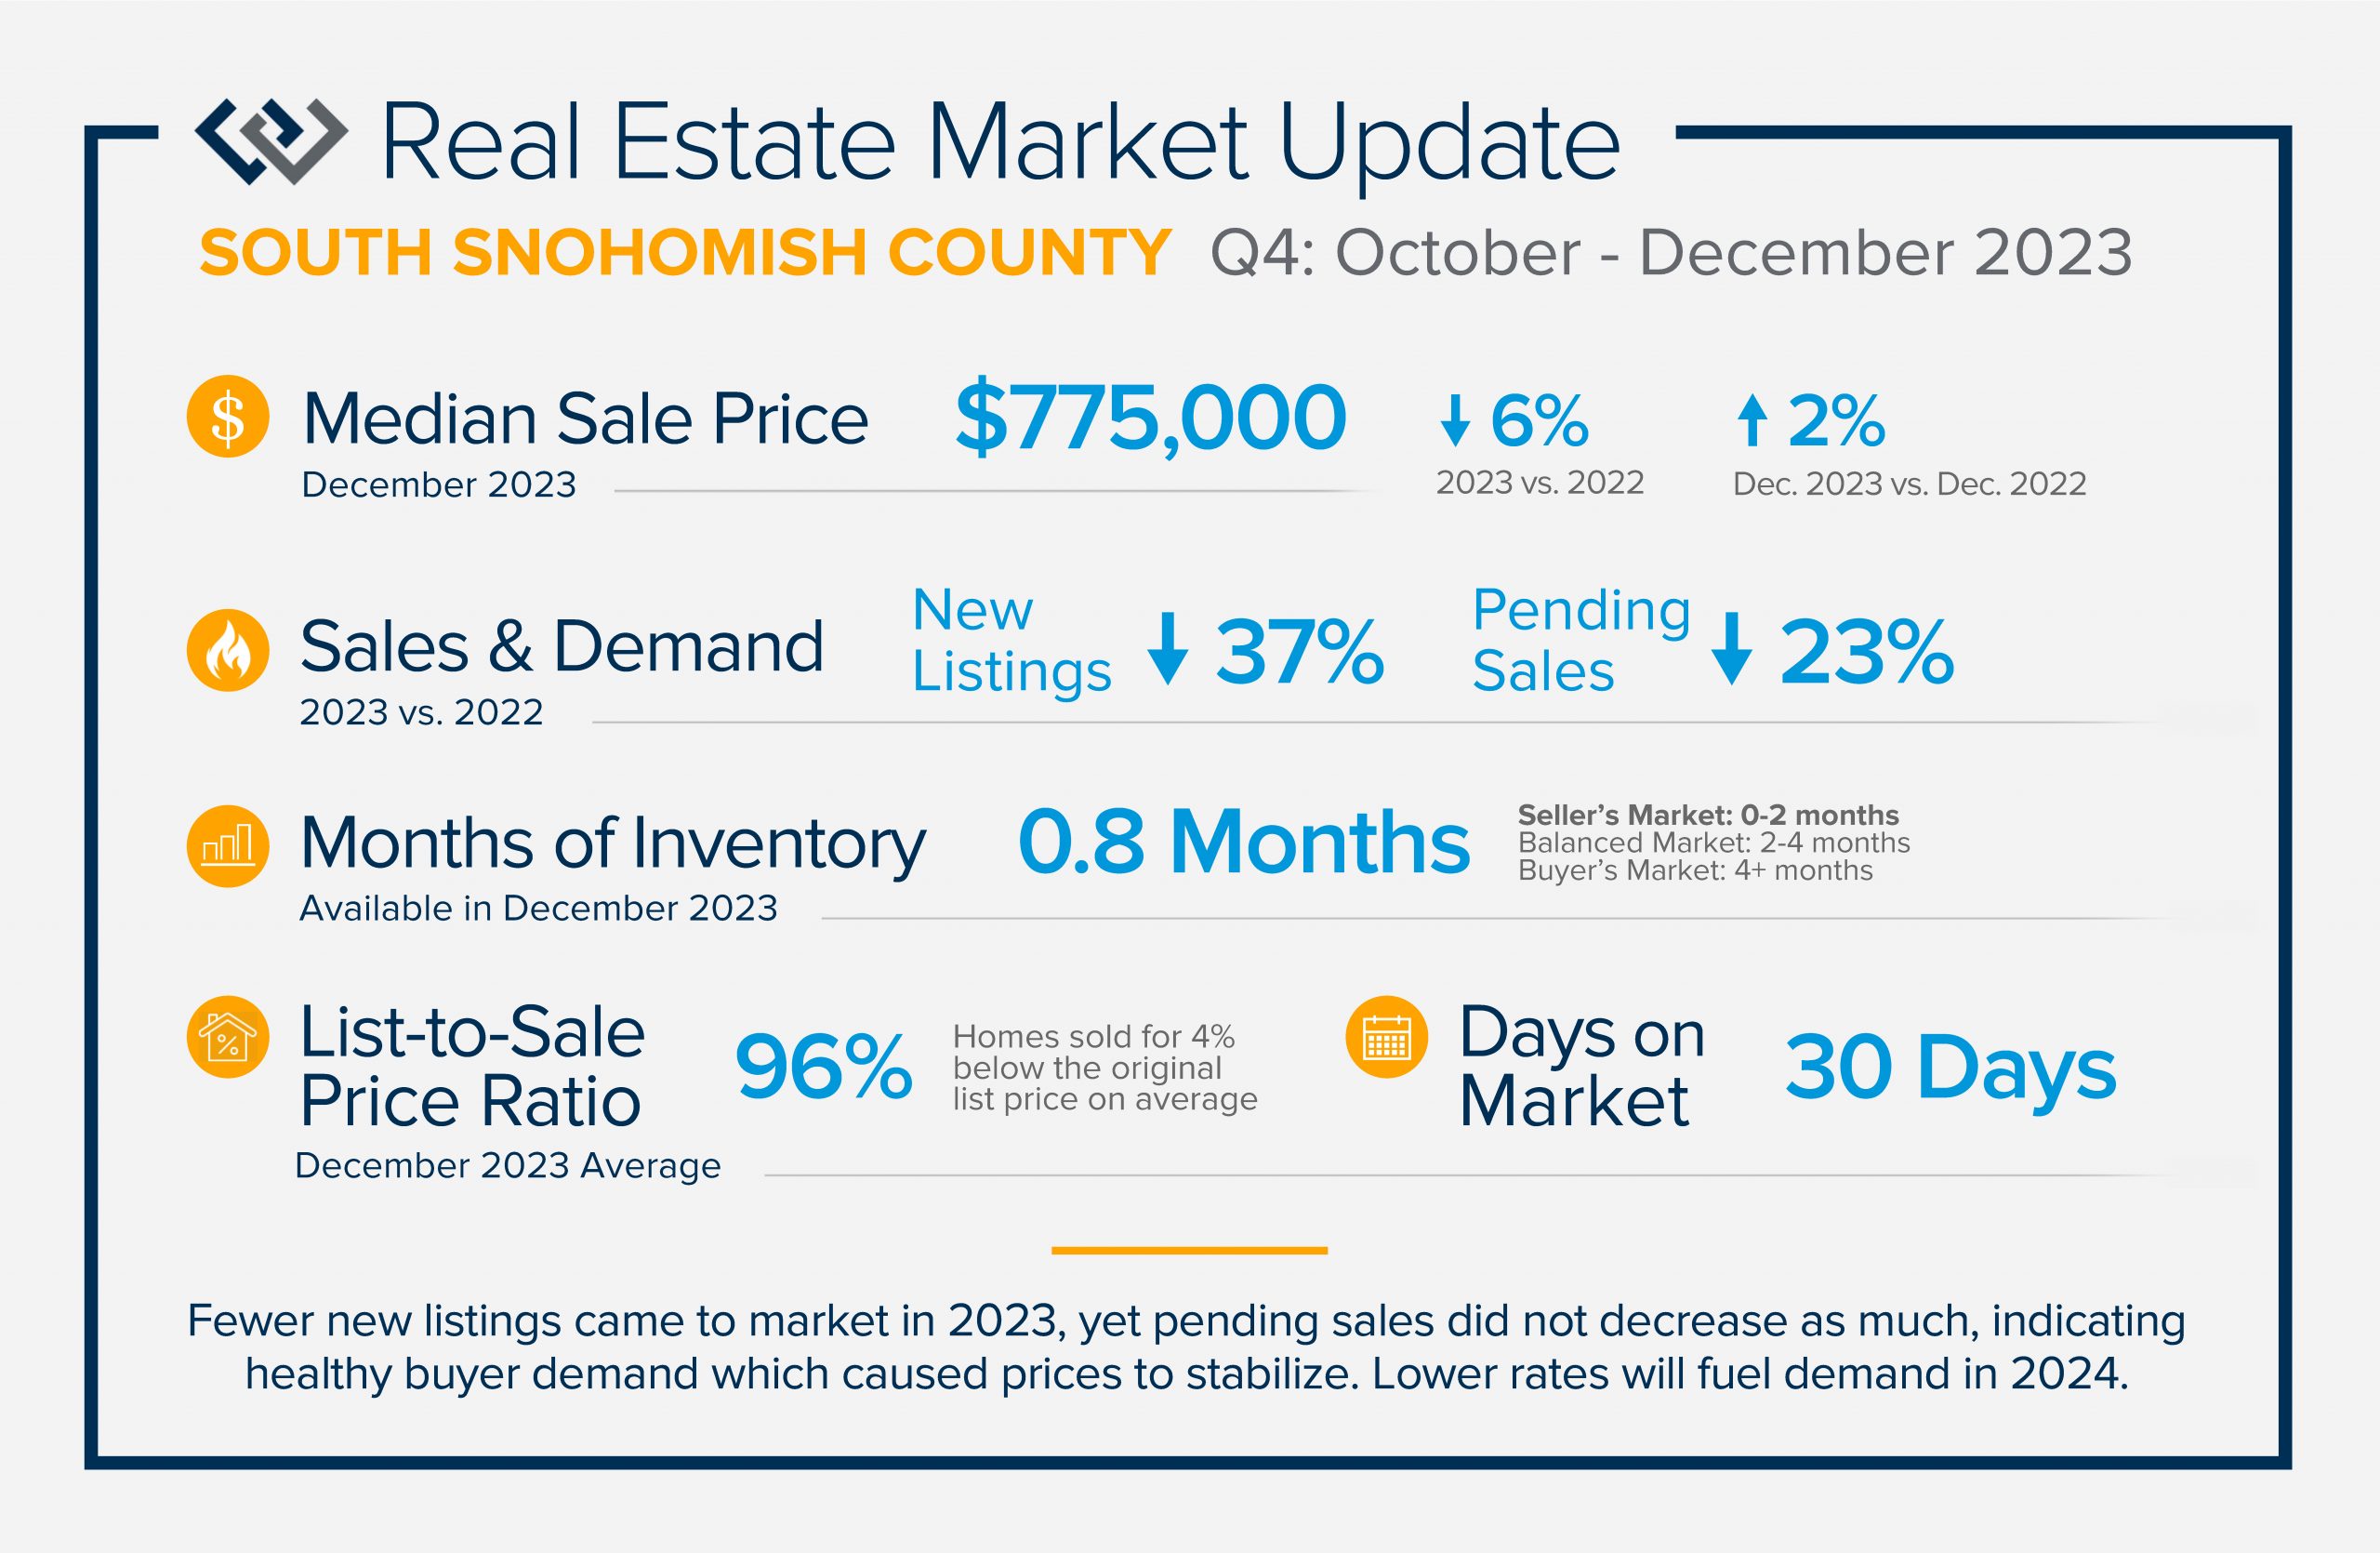 y rate in 2023 was 6.8% and peaked in October at 7.94%. This caused some buyers to pause due to cost. Many sellers were reluctant to move and give up their low payments based on historically low rates, hence the large decrease in new listings in 2023.
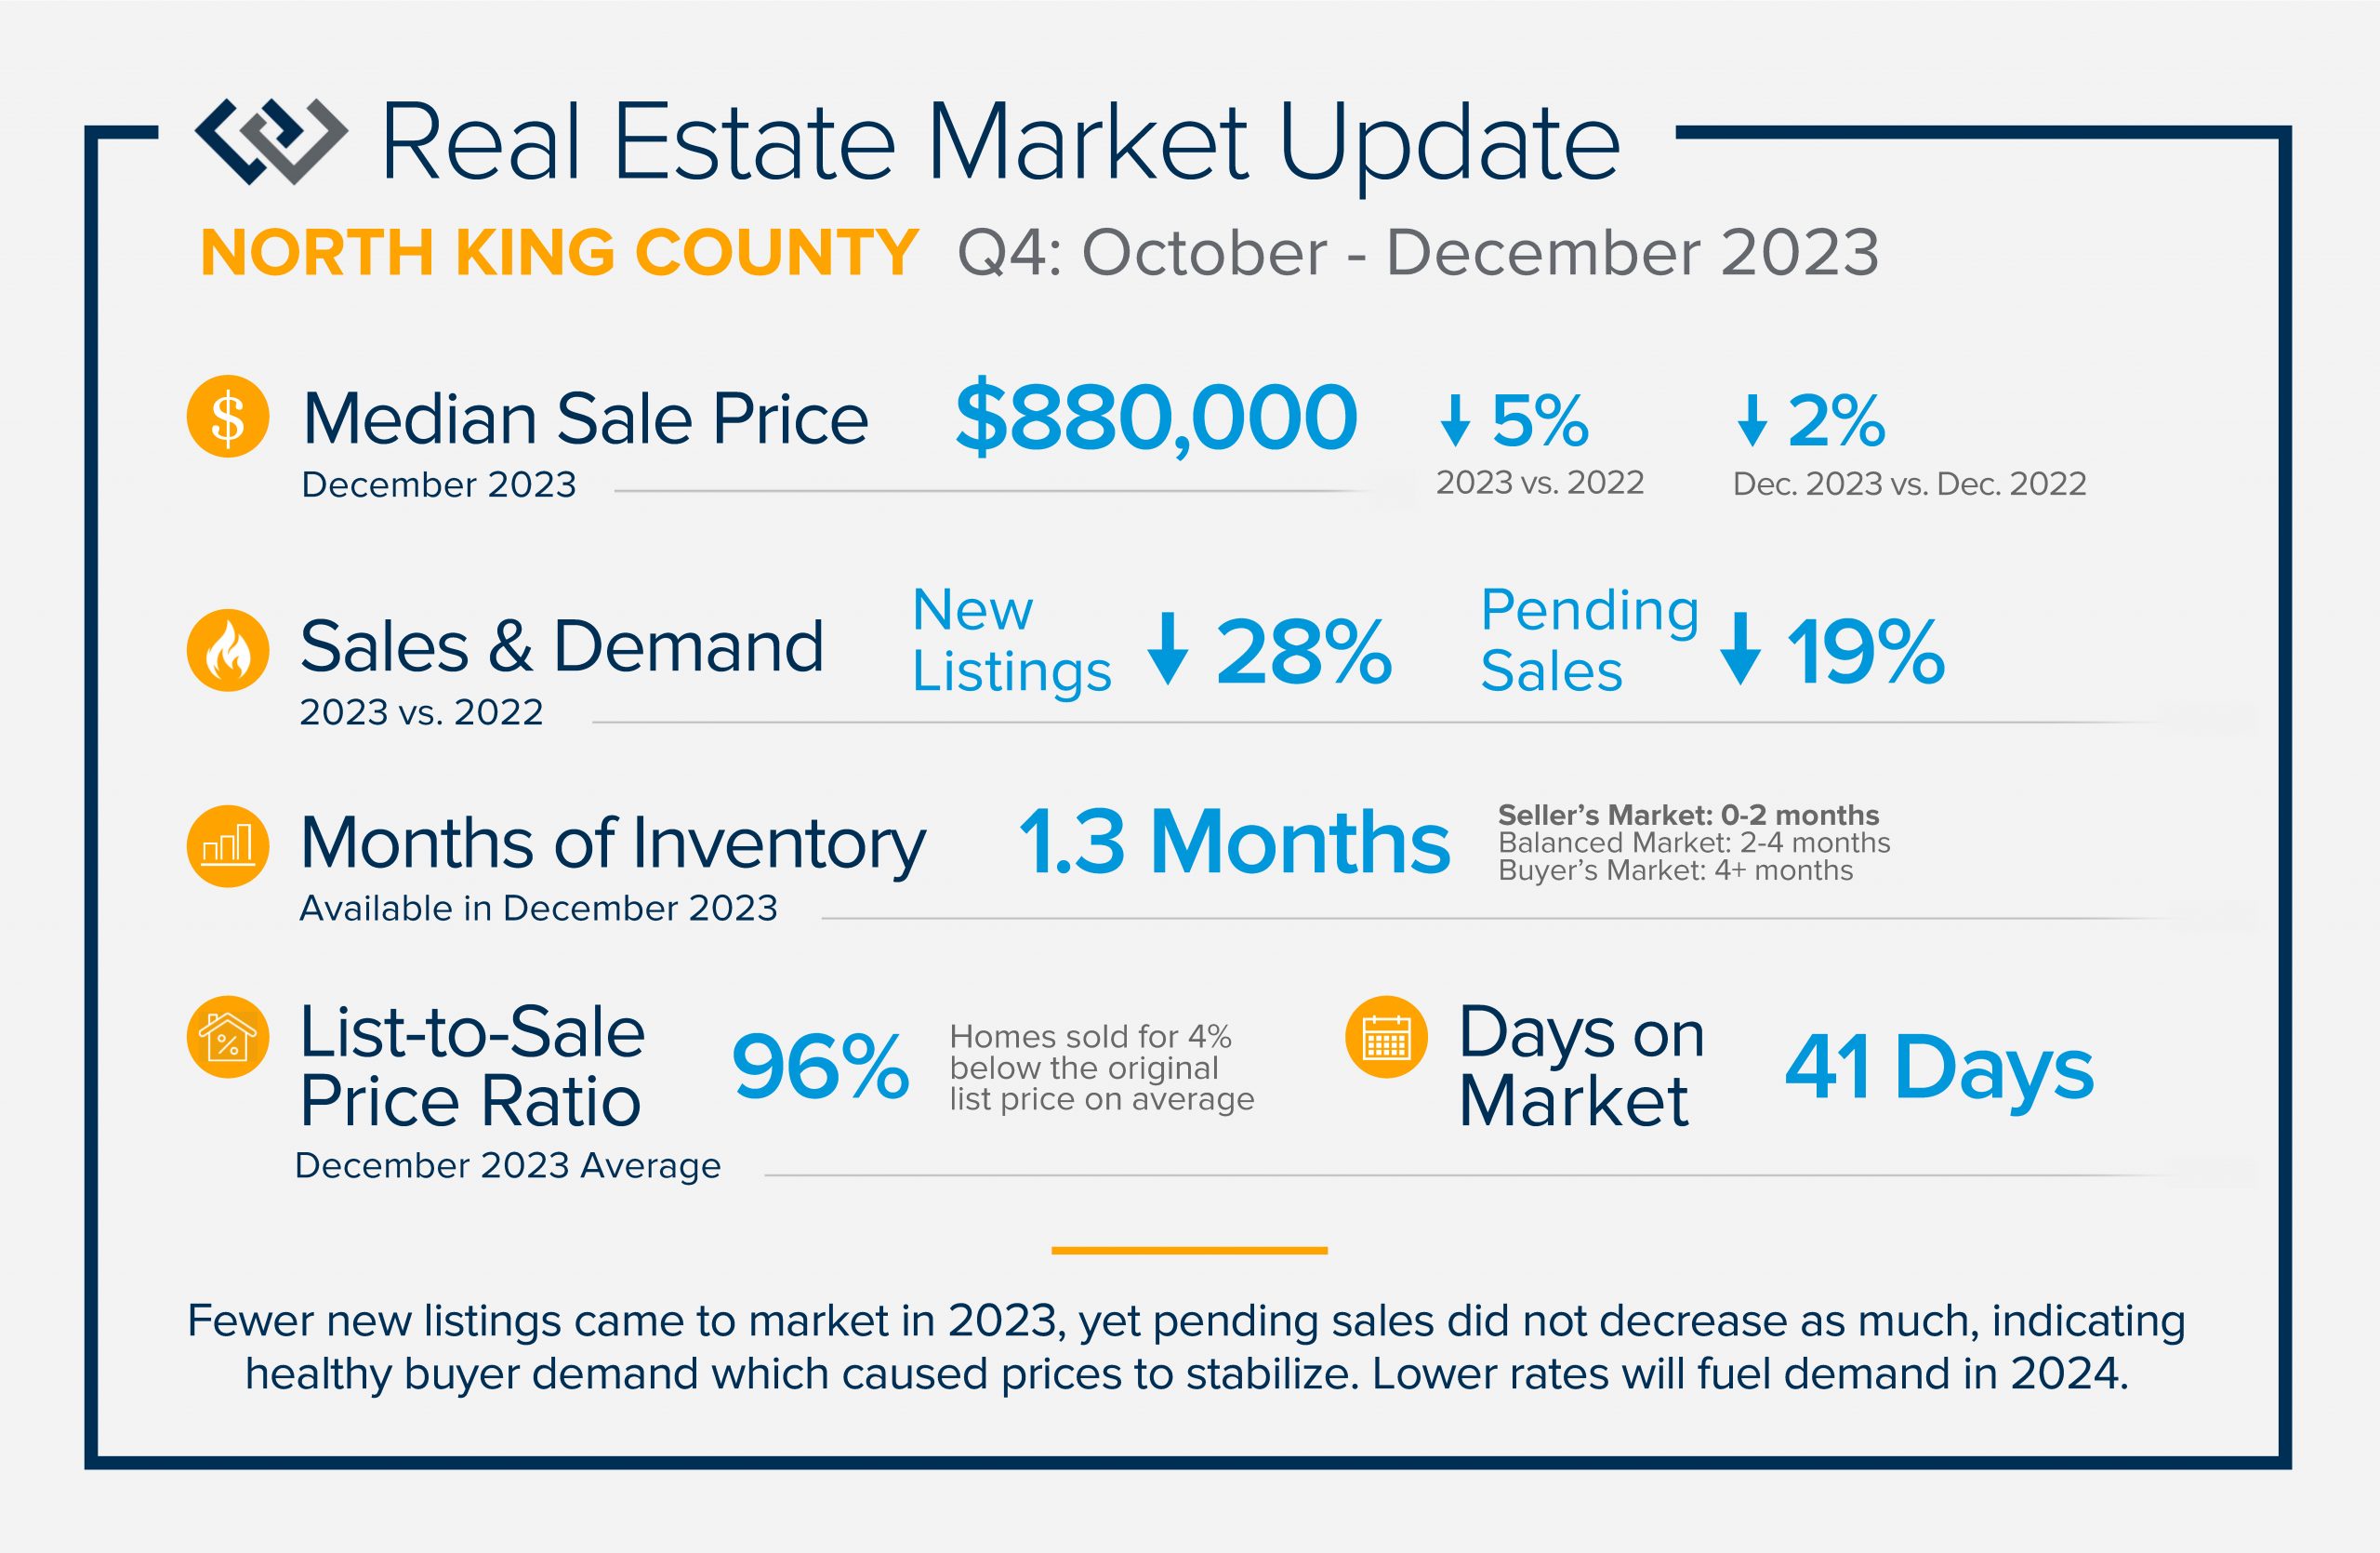
 n 2023 was 6.8% and peaked in October at 7.94%. This caused some buyers to pause due to cost. Many sellers were reluctant to move and give up their low payments based on historically low rates, hence the large decrease in new listings in 2023.
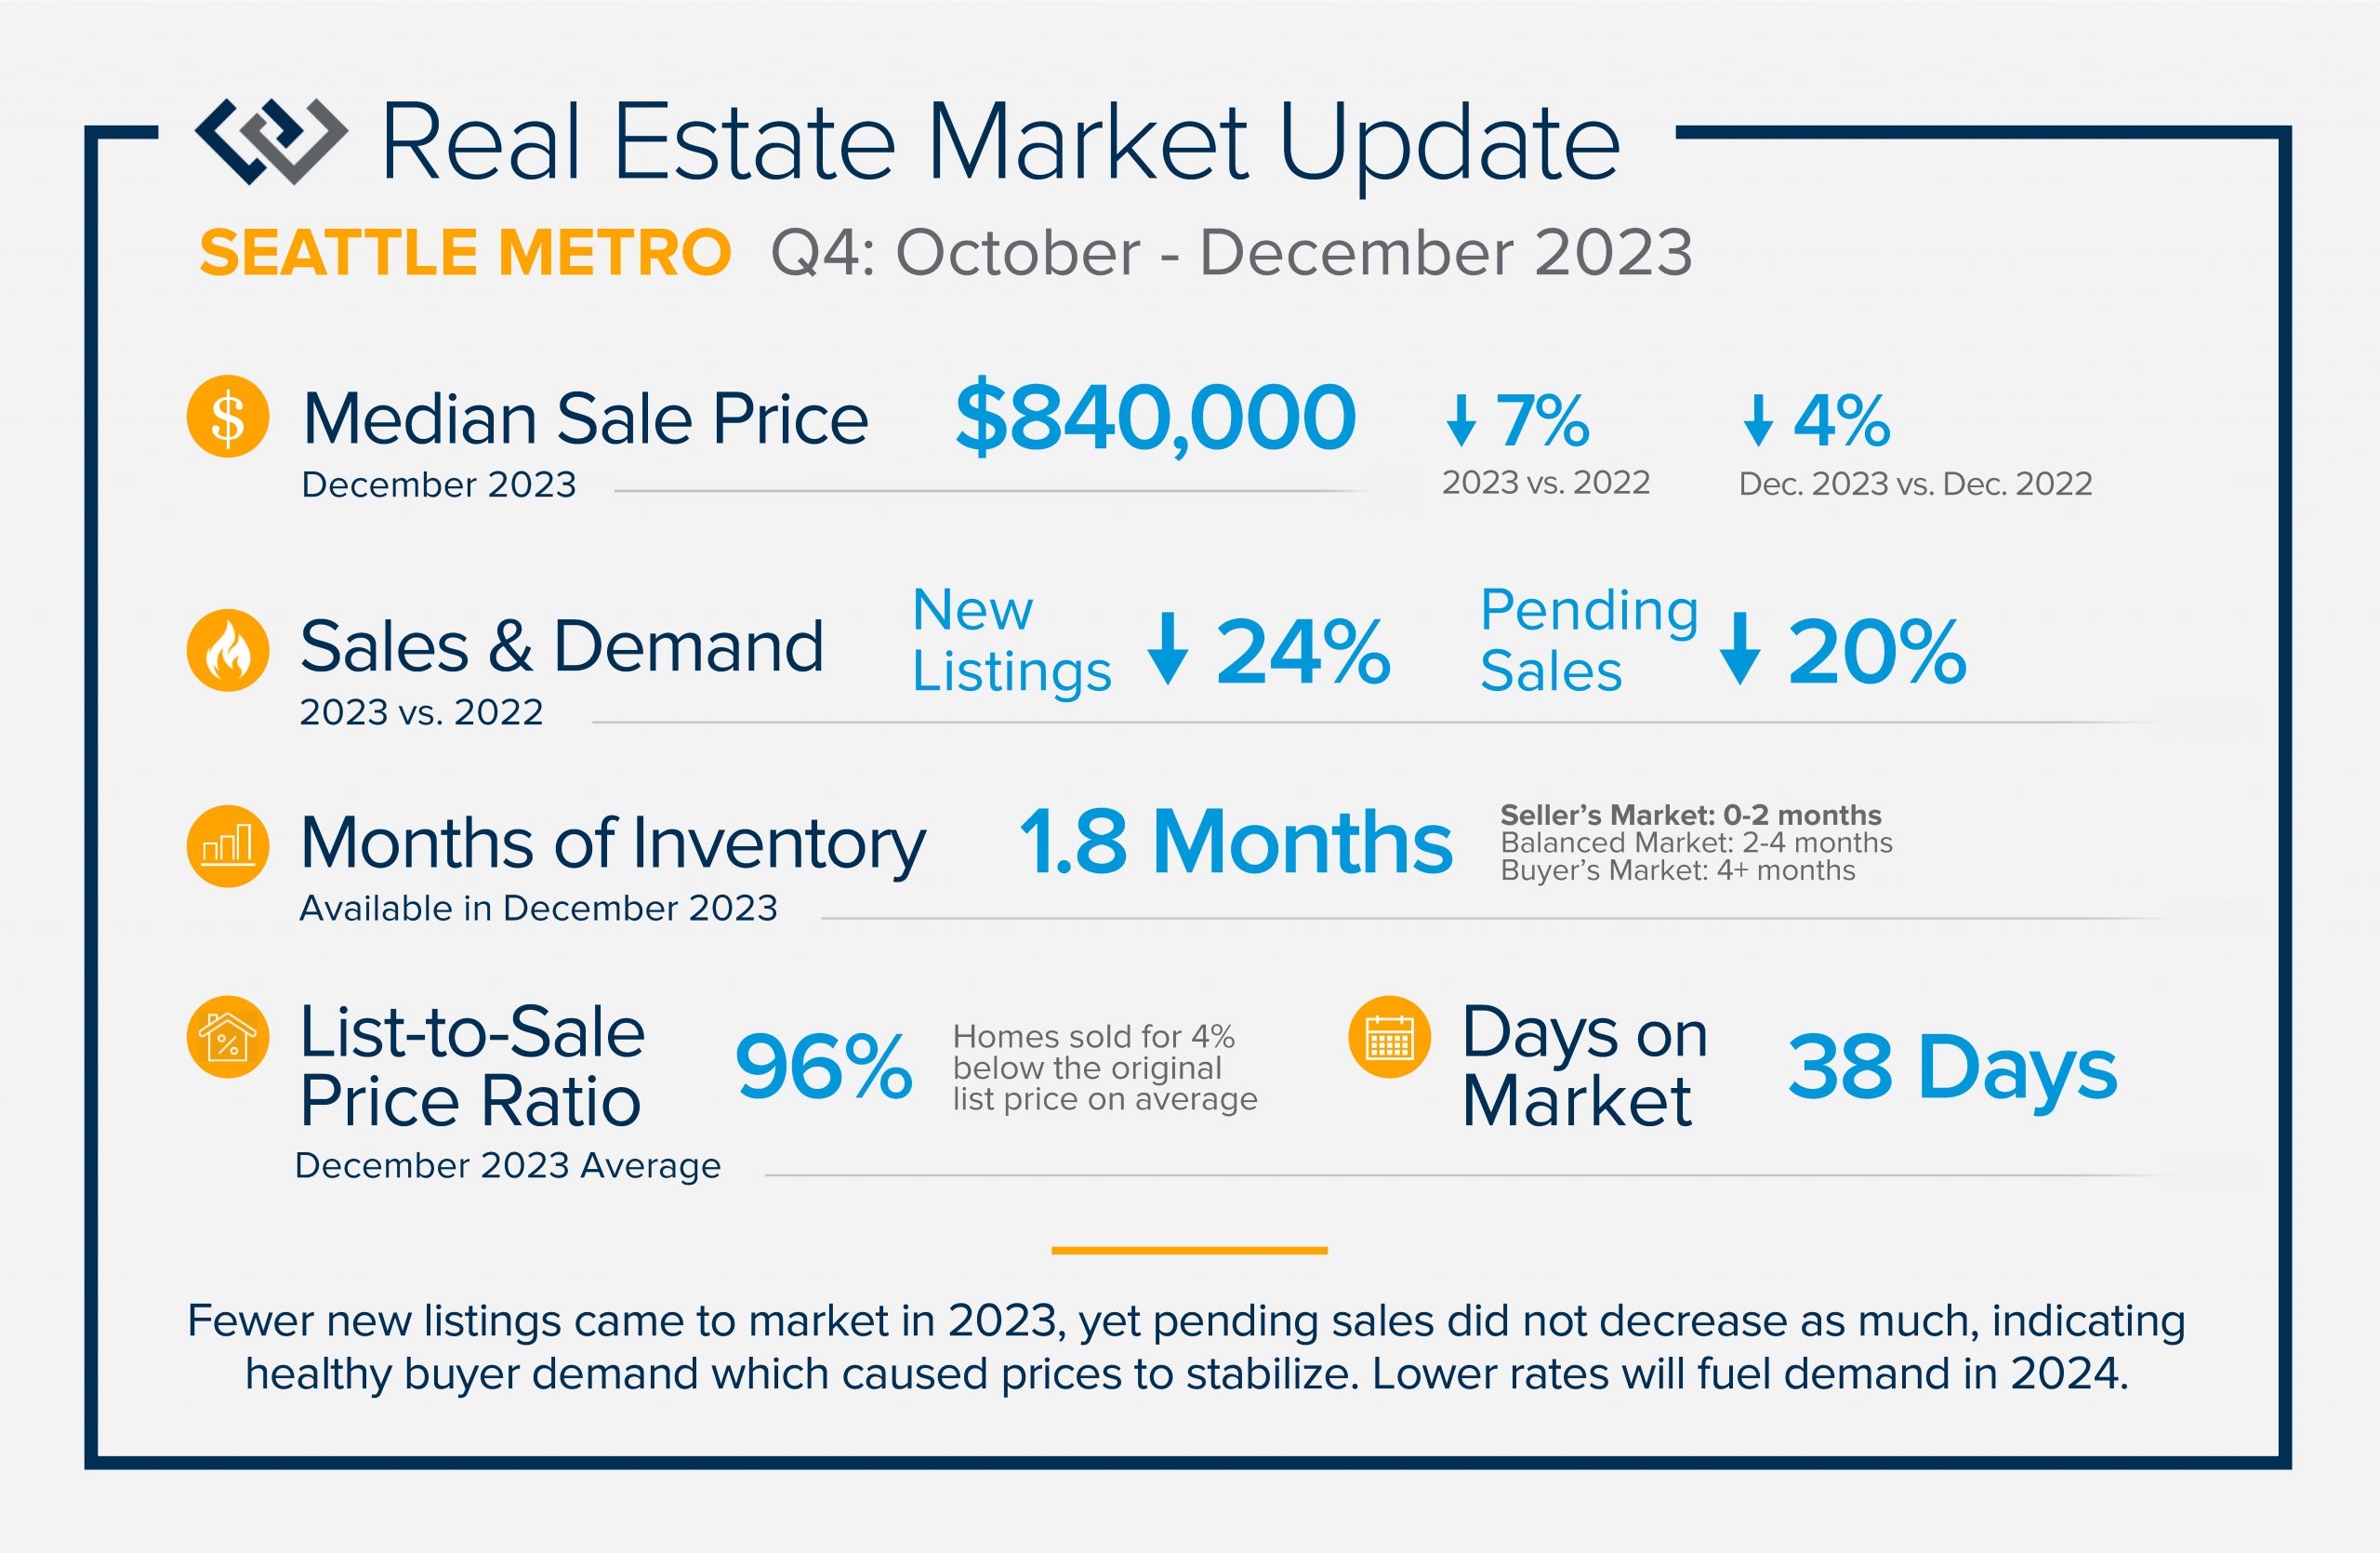 te in 2023 was 6.8% and peaked in October at 7.94%. This caused some buyers to pause due to cost. Many sellers were reluctant to move and give up their low payments based on historically low rates, hence the large decrease in new listings in 2023.
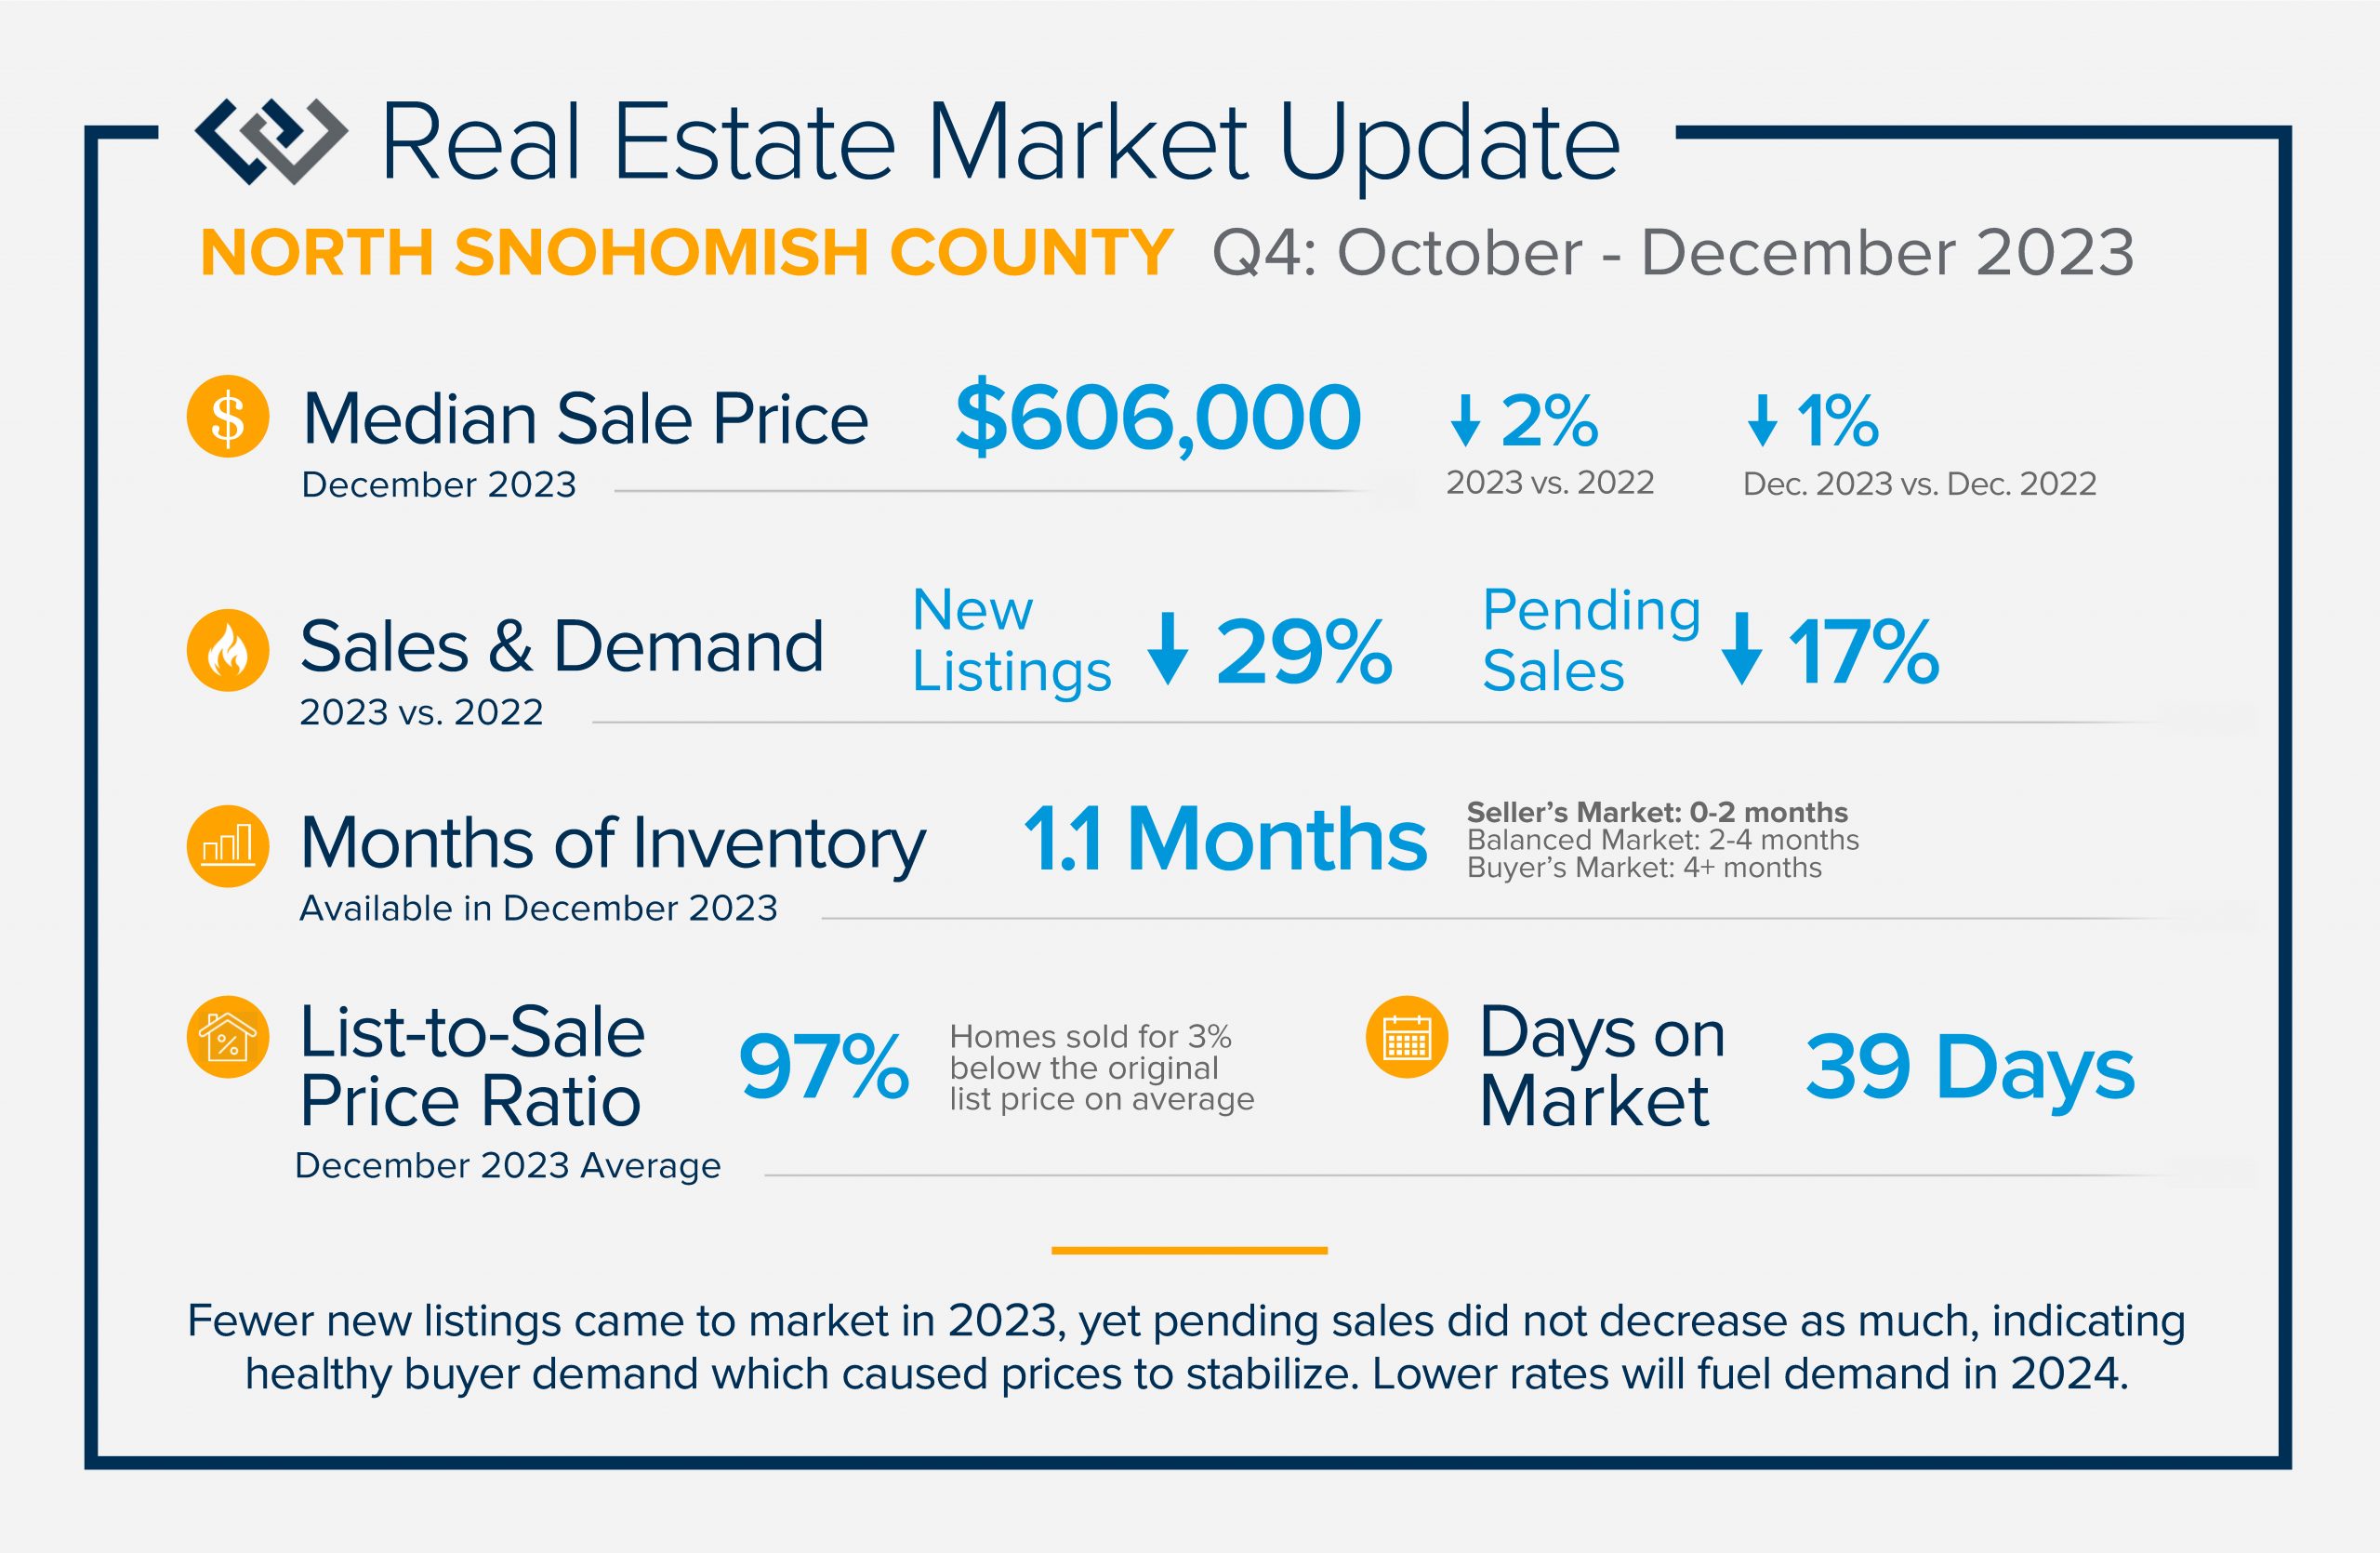 e and give up their low payments based on historically low rates, hence the large decrease in new listings in 2023.
 continued demand and resulting in a seller’s market. Inventory remained tight throughout 2023 and prices stable over 2022 (the peak) when the average rate was 5.34%. Since October, rates have come down by over 1%, bringing more buyers to the market. The Fed plans to continue this trend in 2024 which will increase buyer activity and new listings. 2024 will provide improved opportunities for all with a less stringent lending environment.


 bring some Christmas magic to homeless/housing-insecure youth in our area. We partnered again this year with


