Facebook
 X
X
 Pinterest
 Copy Link

Fall has arrived in the PNW and it’s time for cool mornings, warm beverages, beautiful colors, hay rides and pumpkin picking. Head out to a local farm for fresh produce and family-friendly activities.
This is by no means an exhaustive list… there so many farms in our area, especially Snohomish County. Leave a comment with your favorite if it’s not on the list!
*Please always check websites for confirmation of activities, hours, possible closures, and any other details.
SOUTH SNOHOMISH COUNTY
Biringer’s Black Crow Pumpkins & Corn Maze – Arlington
Pumpkin patch and corn maze. Local cider, honey and produce. Fall fun! Pet-friendly.
Bob’s Corn & Pumpkin Farm – Snohomish
Tractor rides, pumpkin patch, corn maze, night maze, bonfire rentals, concessions. Fresh produce at the Country Store and lunch and dinner are available on the weekend at the Country Kitchen.
Carleton Farm – Lake Stevens
No frills pumpkin patch, animals, market, concessions, and free parking are all open to the public at no charge.
Craven Farm – Snohomish
Corn maze, hayride, pumpkin patch, fire pit rentals, concessions, autumn décor.
Legacy Farm – Monroe
Pumpkin patch, kids corn maze, covered hay ride, barrel train, kid zone playground, animals, carnival games, papa’s fire truck, family photo area, festive food & drink.
The Farm at Swans Trail – Snohomish
Pumpkin Patches, fresh-pressed cider, corn maze, concessions. Animals, kids play area, live duck races, pigs show, hay rides, cow train, indoor slides, tractor pull, zip lines and more.
Fairbank Animal Farm & Pumpkin Patch – Edmonds
Pumpkin patch, farm animals, toy duck races, hay tunnel and more.
Stocker Farms – Snohomish
Pumpkin patch, corn maze, family photo areas, concessions, kids play areas, hay ride, bubble barn, duck races, tractor slide, gaga ball, steer & pig roping, and more. New, Saturday nights fireworks extravaganza.
Thomas Family Farm – Snohomish
Pumpkin patch, corn maze, kids fun park, 5-hole putt putt, heated & covered beer garden, escape rooms, haunted house, monster truck rides and more. Night activities: zombie paintball, haunted trail, haunted house.
KING COUNTY
Carpinito Brothers – Kent
Pumpkin patch, corn maze, kids activities, farm animals, hay maze, goat walk. No pets allowed.
Fall City Farms – Fall City
Pumpkin patch, farm animals, concessions. No pets allowed.
Jubilee Farm – Carnation
Pumpkin patch, hay rides, concessions, farm market, and more. Free admission. No pets allowed.
Oxbow Farm – Carnation
Oxtober celebration 10/15, 16, 22, 23: pumpkins, living playground, Oxboat ride on pumpkin river, farm-fresh produce. Registration on website.
Remlinger Farms – Carnation
Pumpkin patch, apple cannon, pony rides, mechanical rides, farm animals, giant swing, play area, pioneer village, concessions and more.
Serres Farm – Redmond
Pumpkin patch, animal train, corn maze.
Thomasson Family Farm – Enumclaw
Pumpkin patch, corn maze, laser tag, farm animals, play areas, apple slingshot, tetherball, giant Jenga, giant Connect 4, photo ops and more.
Yakima Fruit Market – Bothell
Farm stand with lots of local pumpkins, apples, and farm-fresh produce. Corn stalks, hay bales and fall décor.

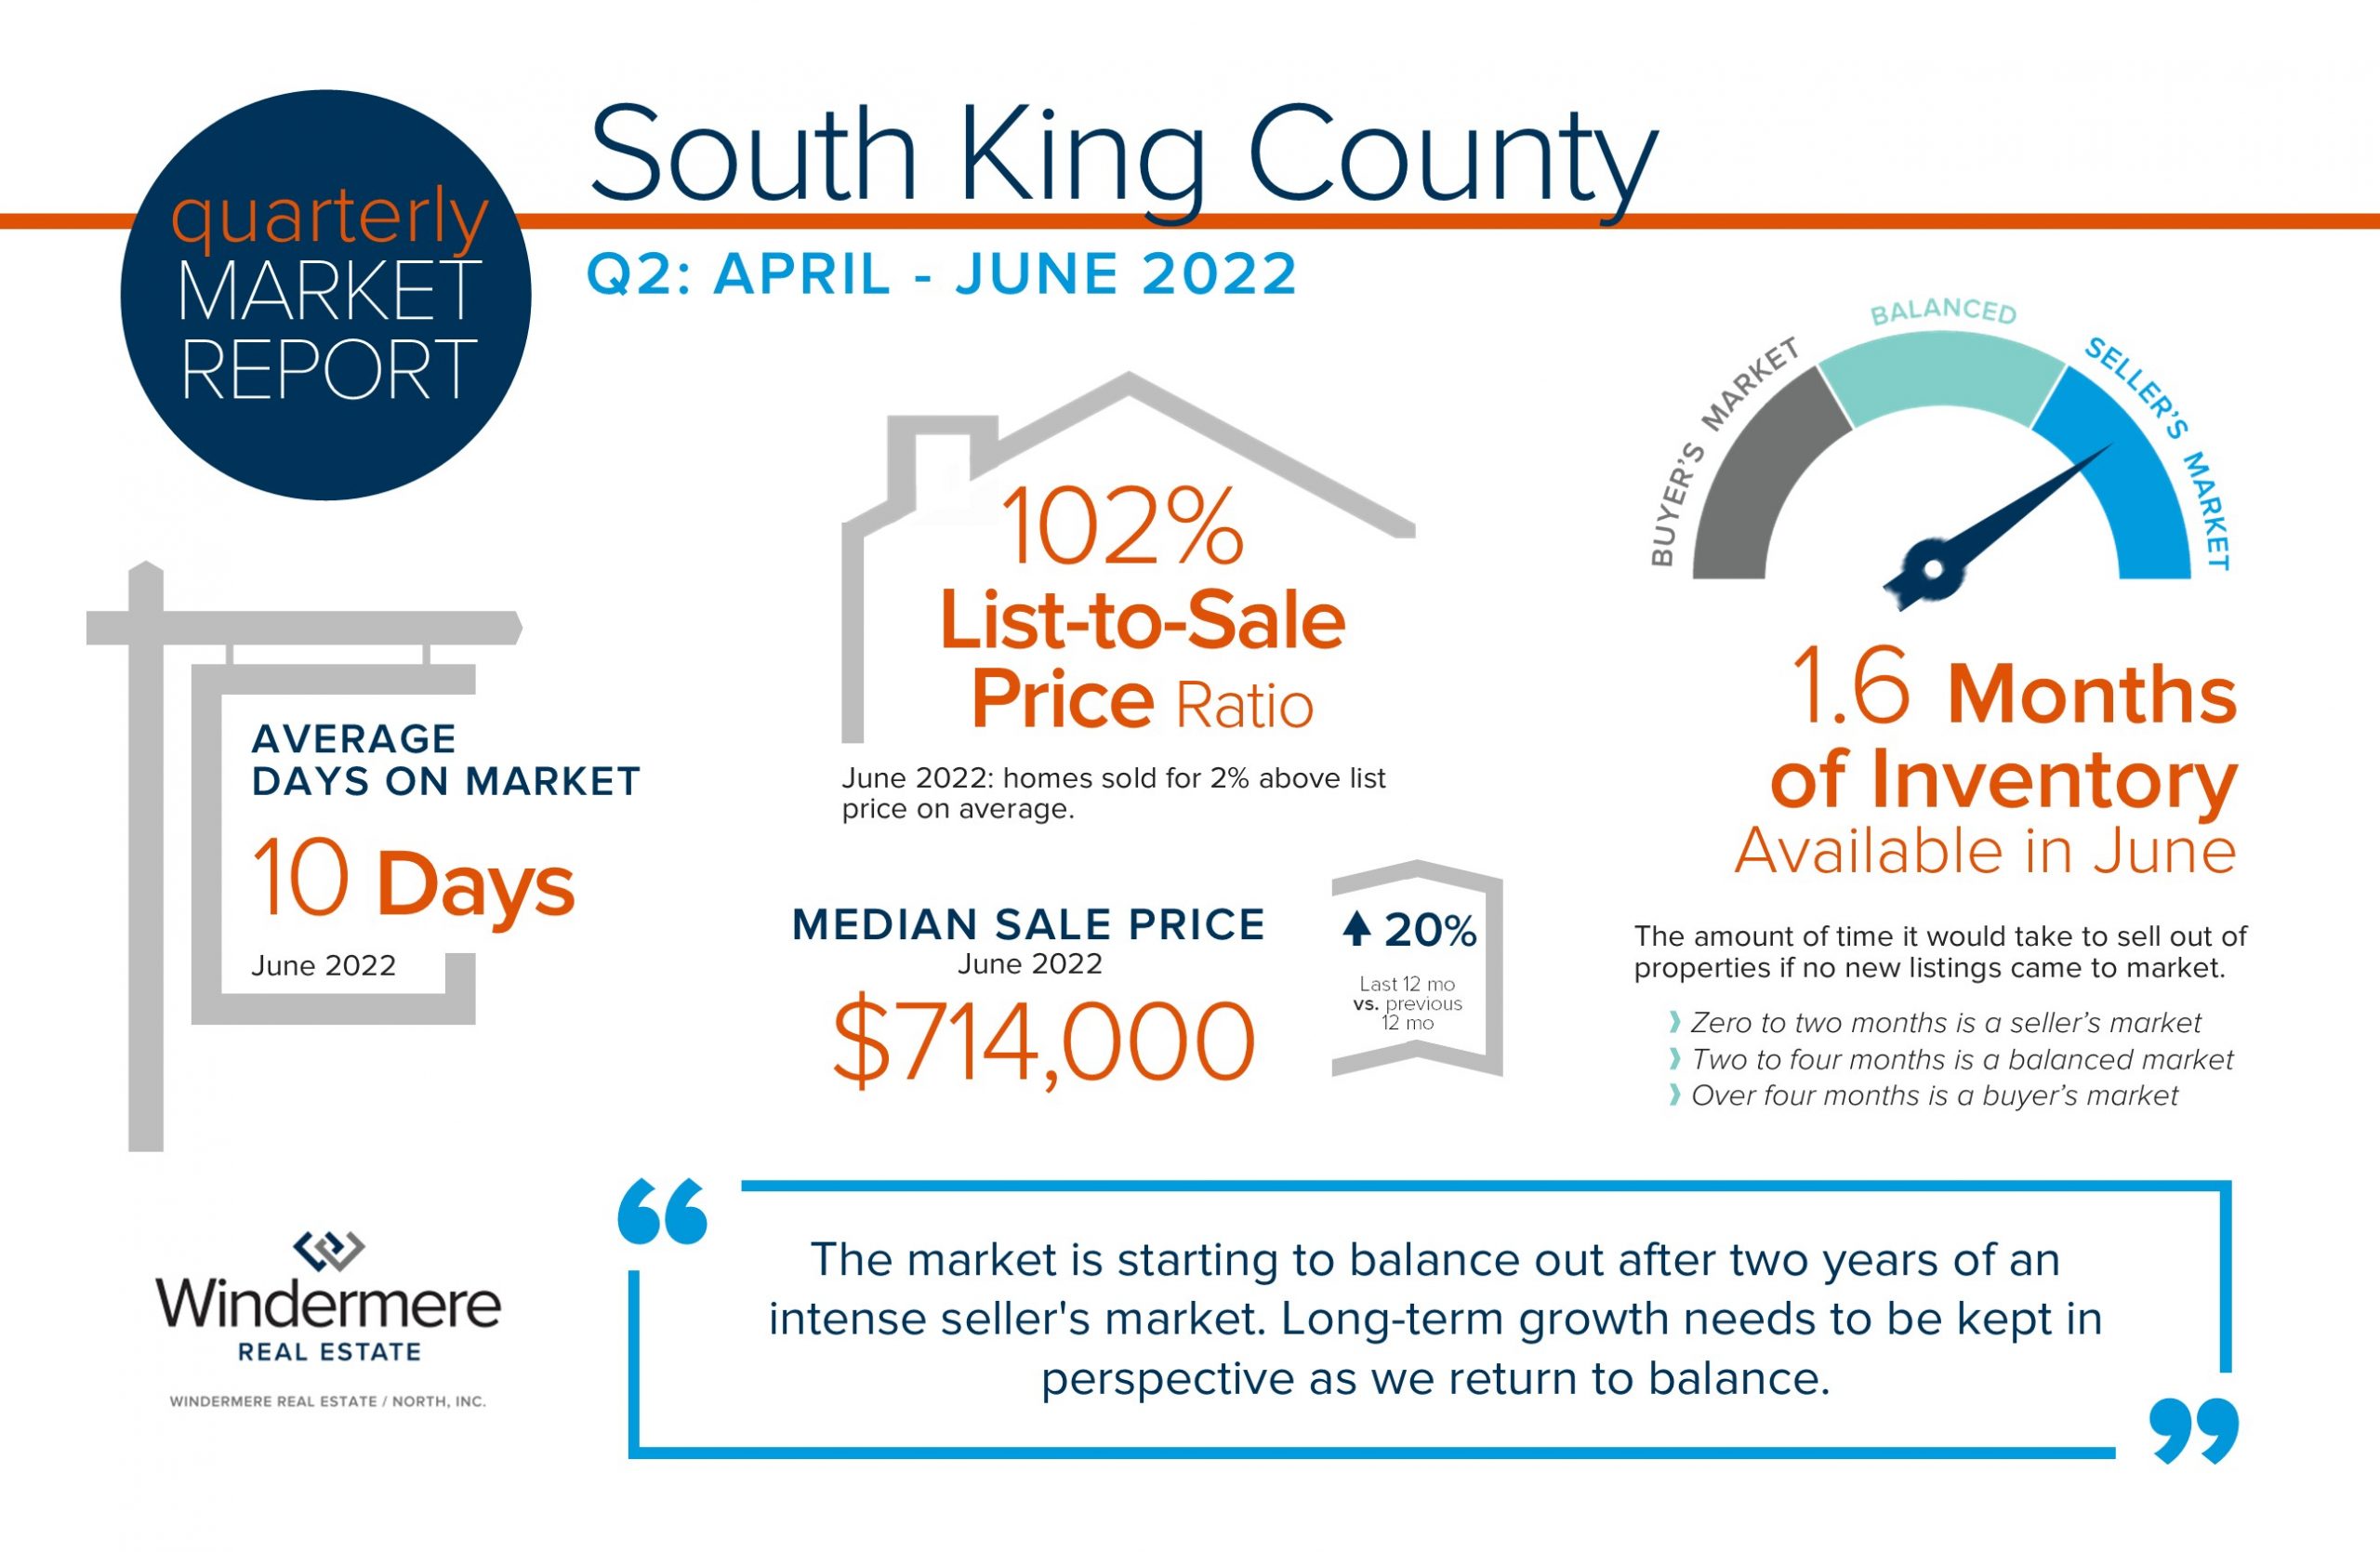
 With that said, sellers have amazing gains to enjoy, and not overshooting their price will lead to the most profitable and drama-free outcome. In King County in August, 37% of homes sold at or above the list price, and 34% in Snohomish County; that is 1 in 3 homes! These homes were brought to market with accurate pricing that attracted a buyer pool that understood the value and was motivated to offer. Market time was also shorter. Homes in King and Snohomish Counties that sold in 15 days or less averaged a list-to-sale price ratio of 100% and homes that sold in 15-30 days took close to a 5% hit on list price. When the days on market get longer the hit on list price gets even higher. It is important to get the pricing right in the beginning. Thorough research, properly focused perspective, and clear communication all play into this success.


 For the buyers who bought during these peak times, it is understandable that there is some angst over the shift in the market. They can find comfort in the low rate they secured, which created a lower payment and offsets the money they put towards debt service. They also need to understand that real estate has always been a long-term hold investment and that future price appreciation is anticipated, but at more historical norms.
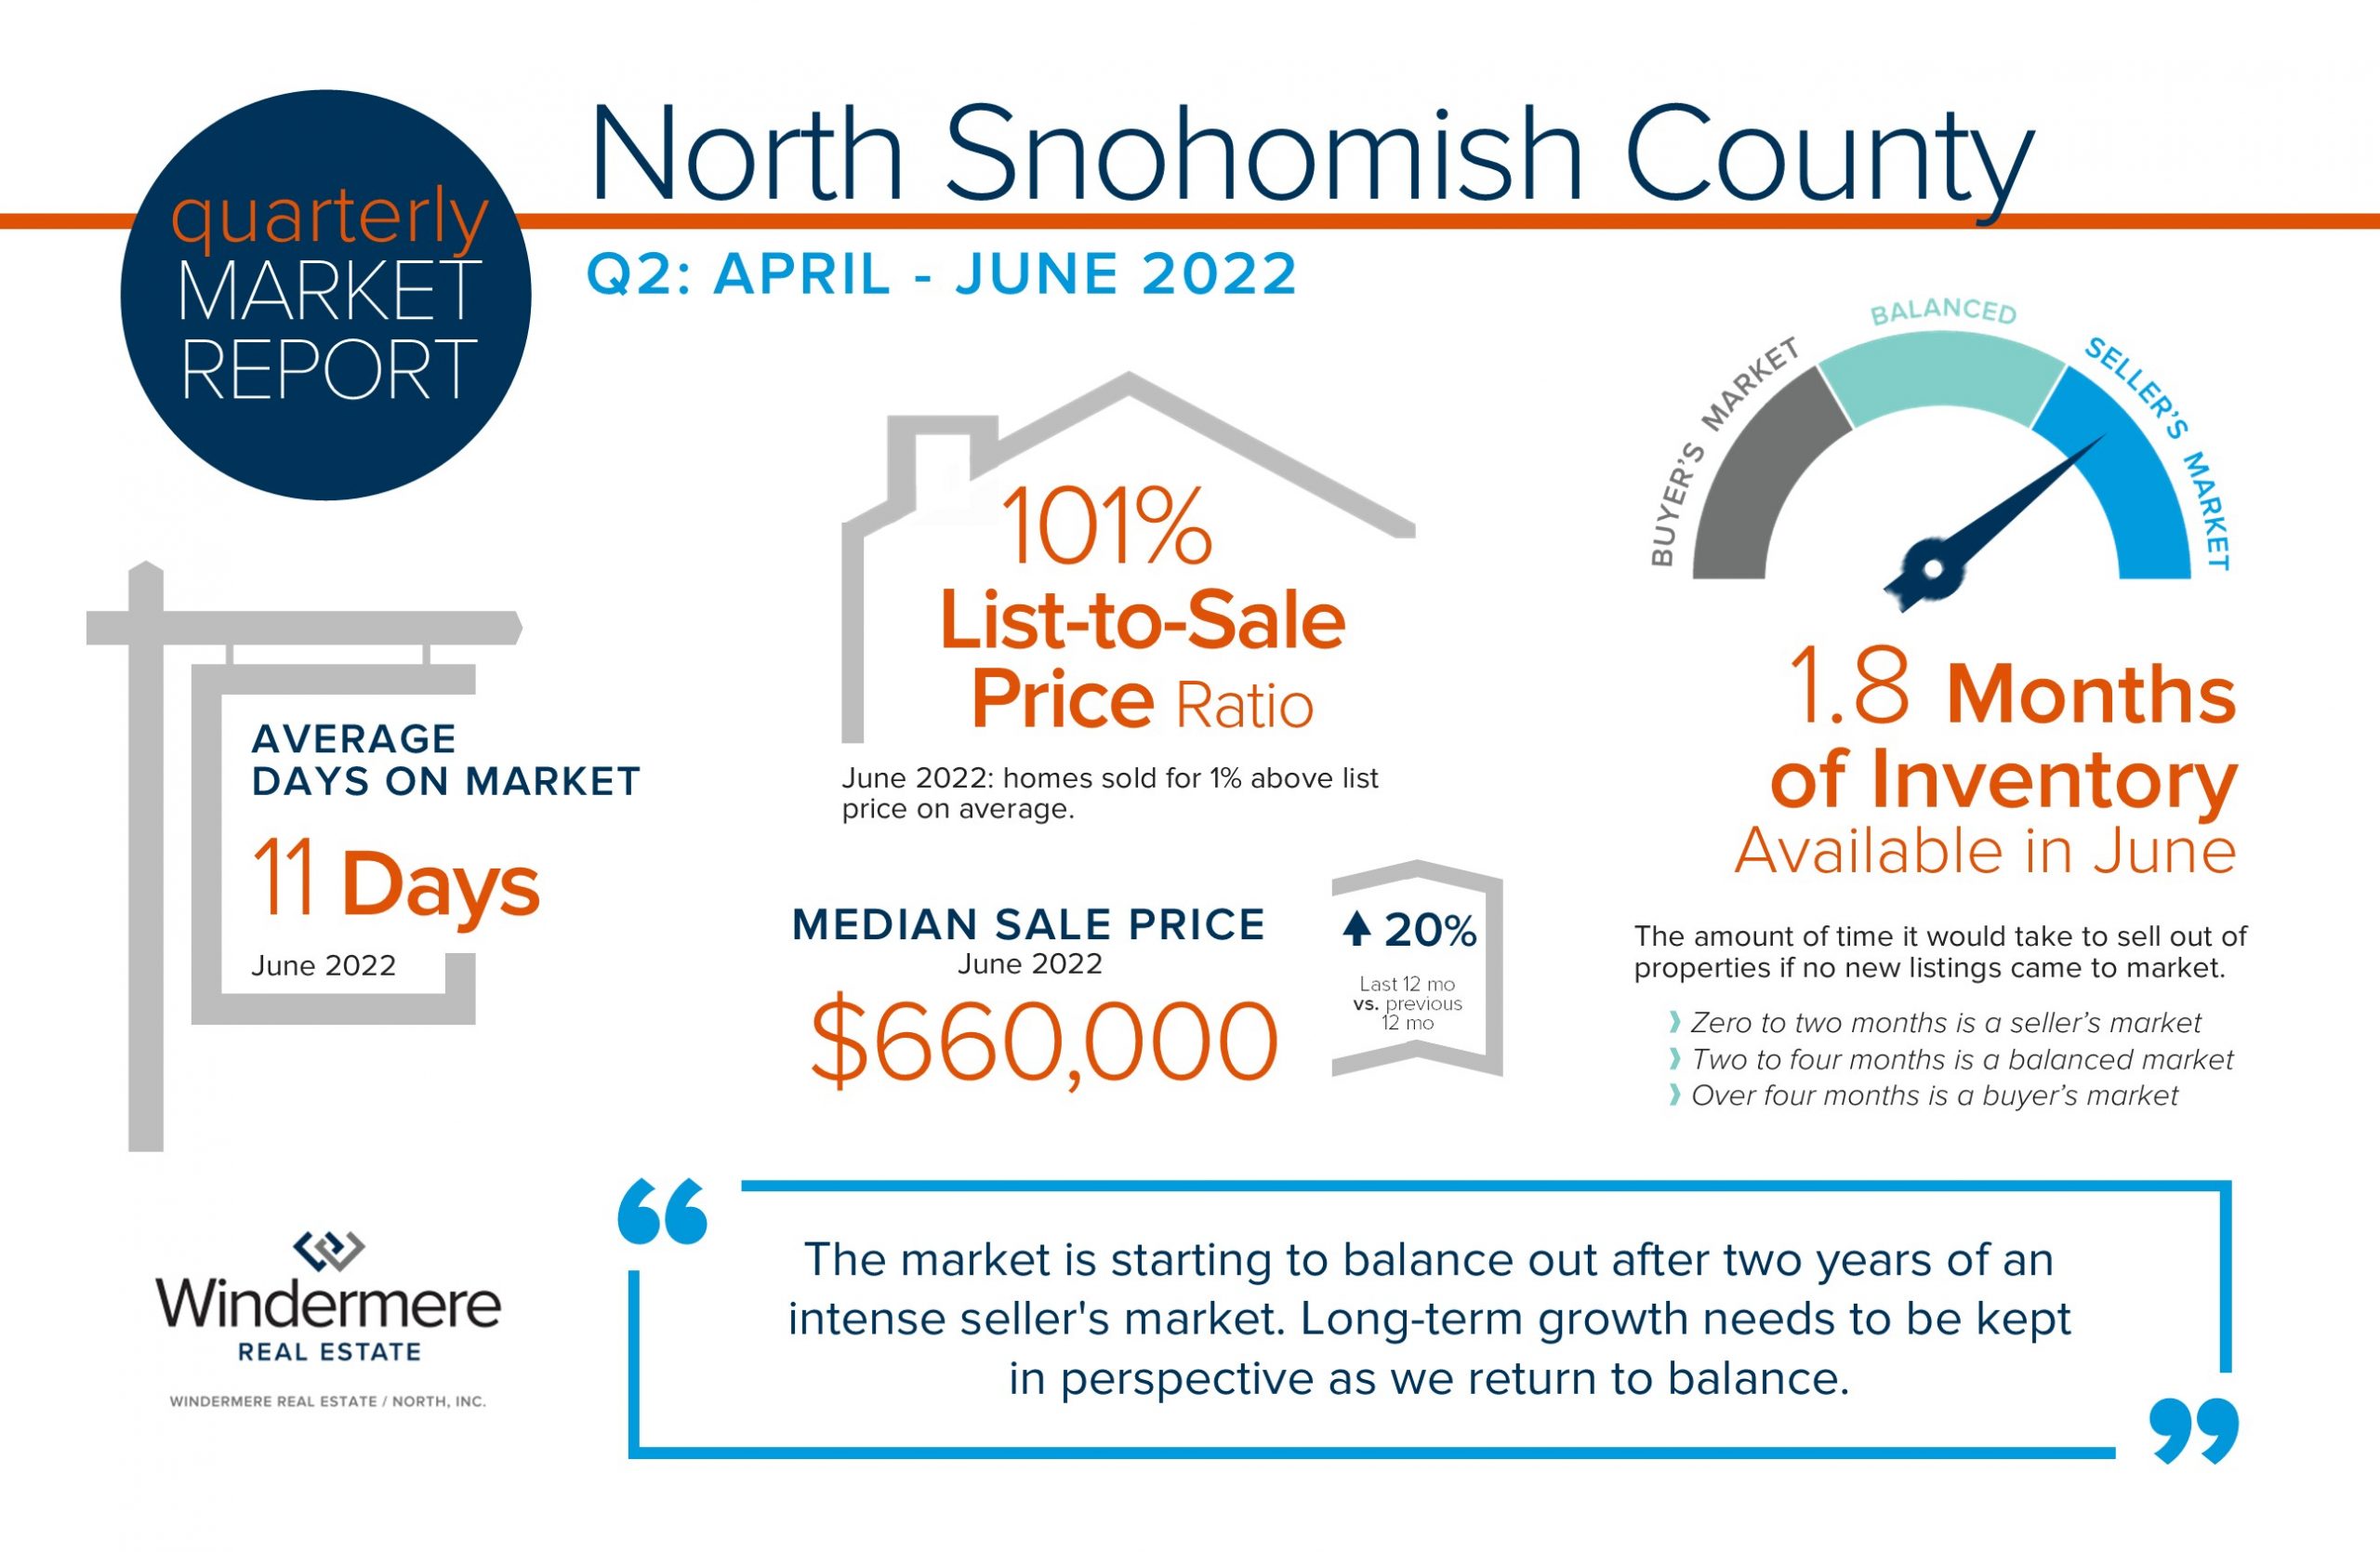
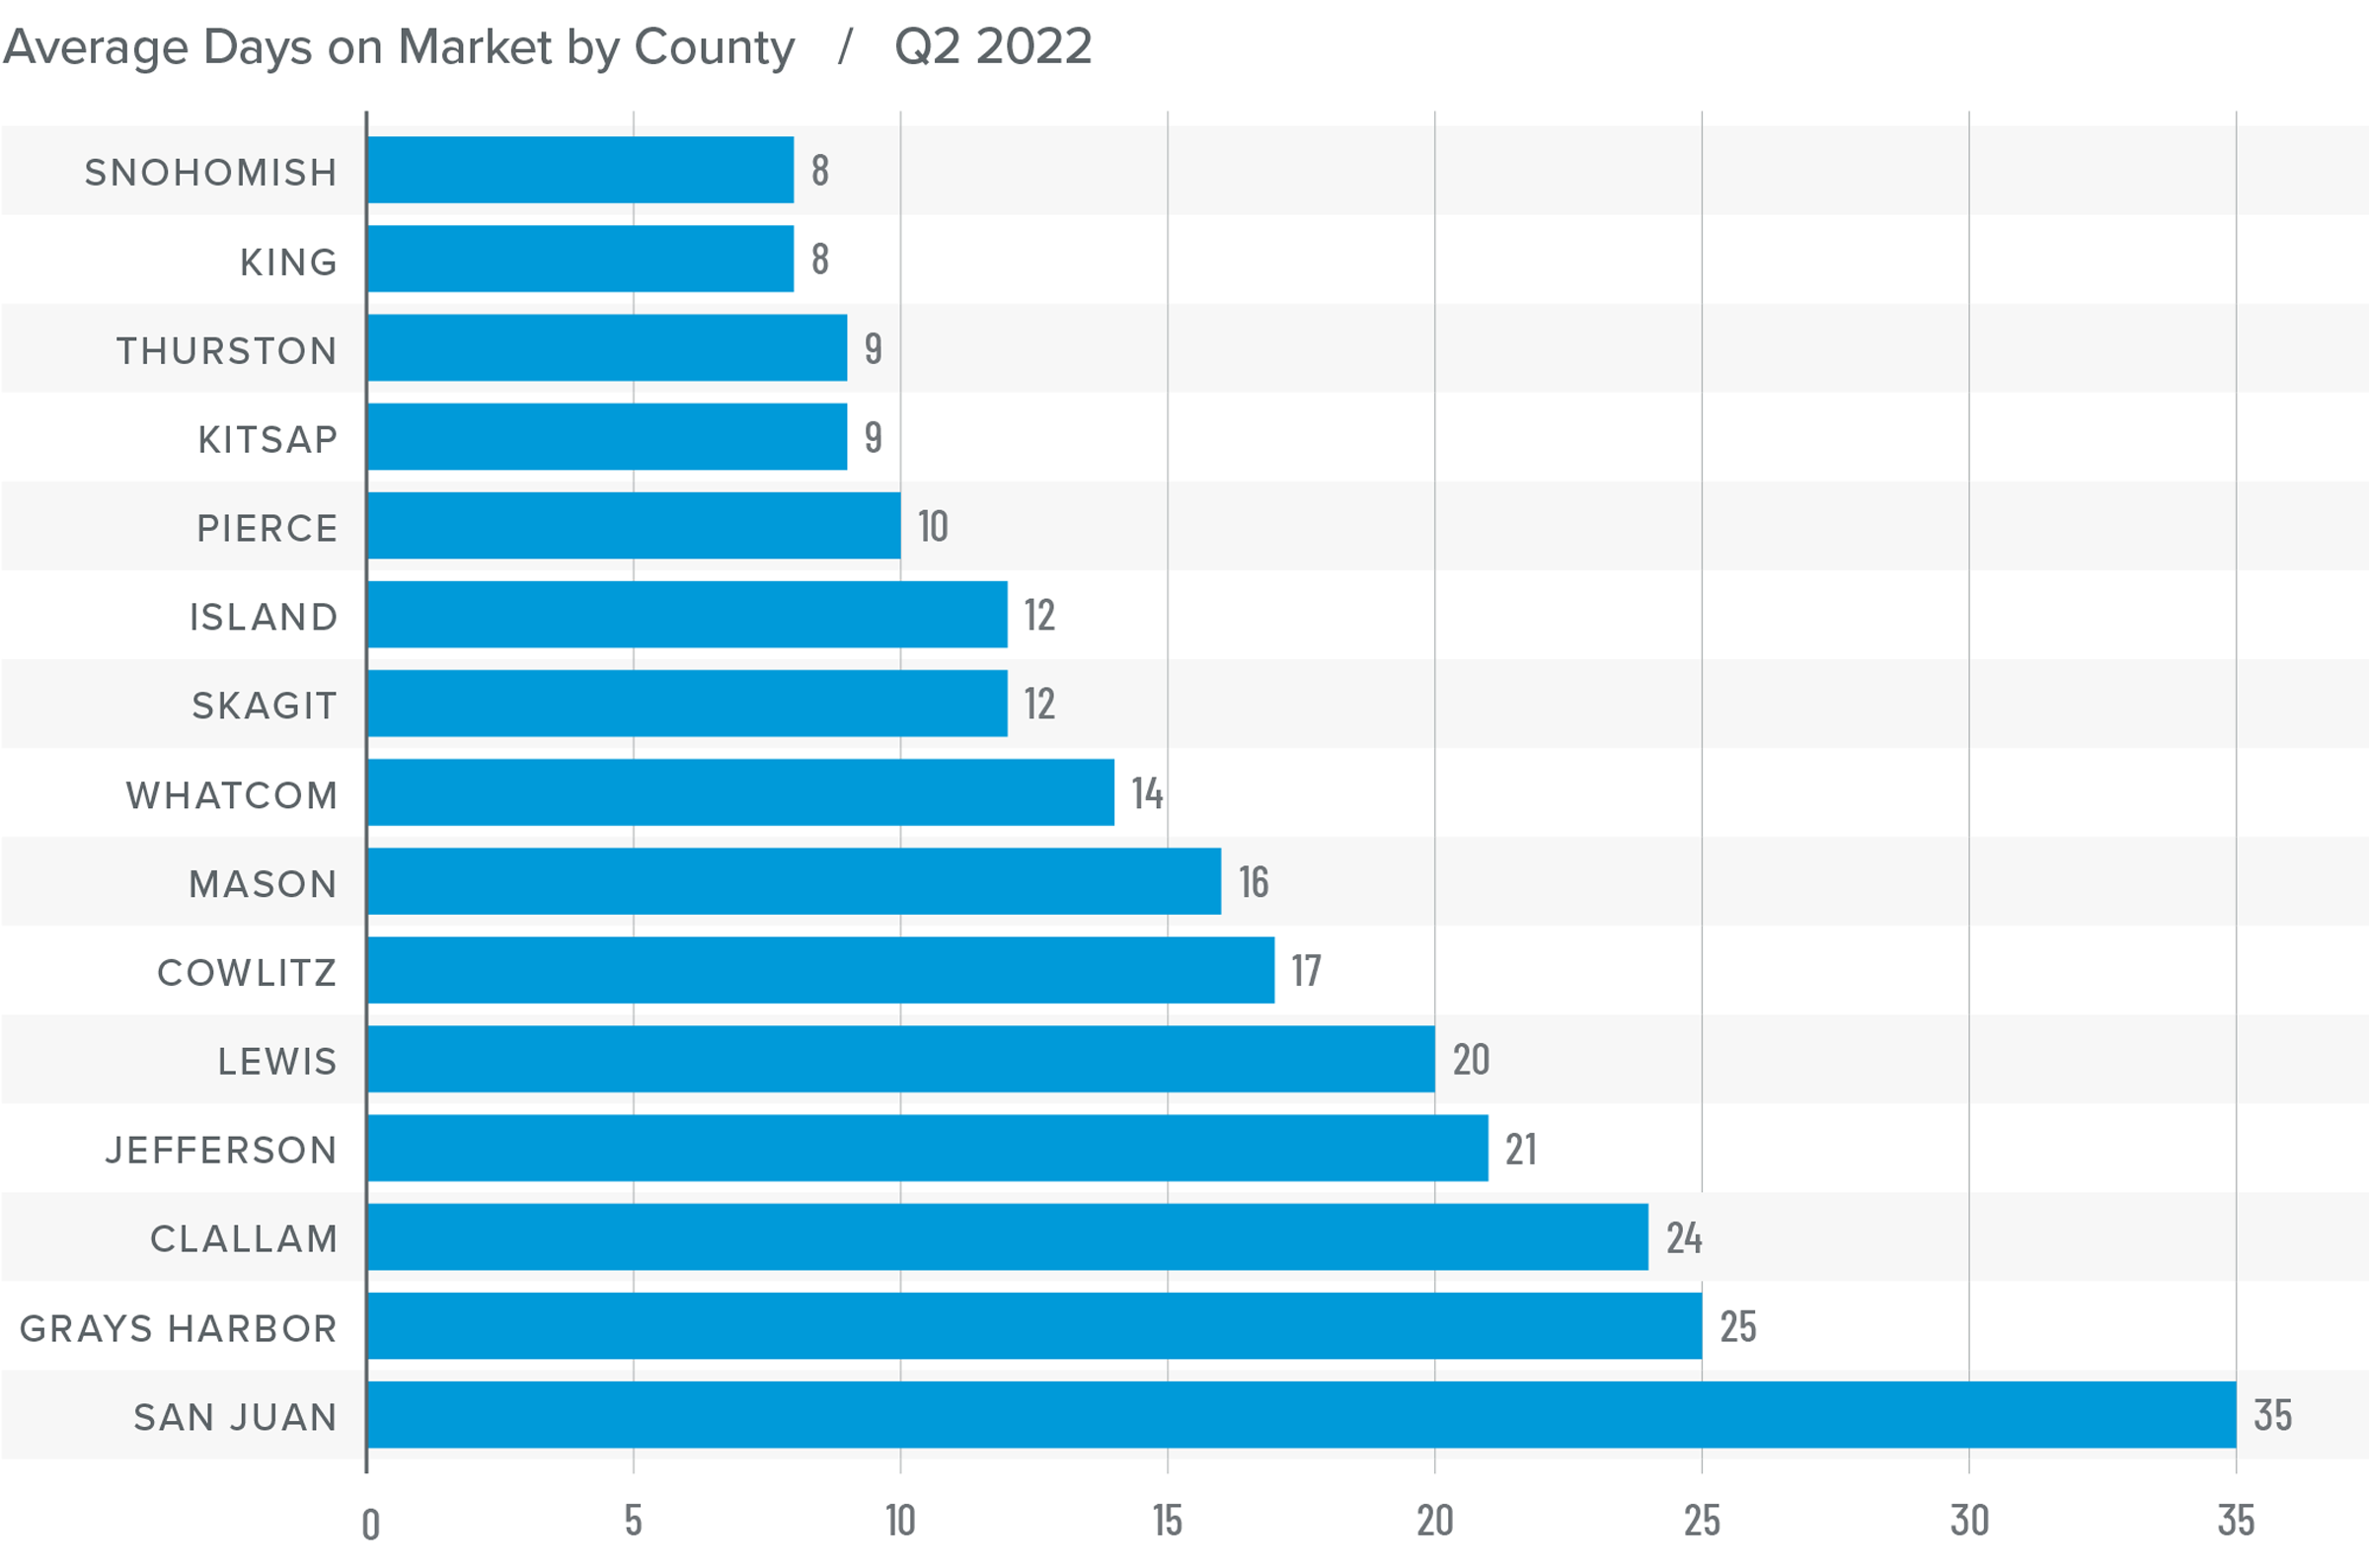
 In Snohomish County, days on market for homes that sold in June for over list price was 5 days, which accounted for 49% of the sales with an average escalation of 5%. This illustrates that there are still great homes that buyers are flocking to, but it is imperative that they are properly positioned in the market. This takes skill, research, and a reasonable approach to find this success as a seller. Conversely, 34% of sales in June sold under list price or took a price reduction and averaged 12 days on market and 27 days on market respectively. This mash-up requires sophisticated navigation and reasonable cooperation, but ultimately sellers will find success because they are sitting on a mound of historical equity growth.
 In King County, days on market for homes that sold in June for over list price was 5 days, which accounts for 50% of the sales with an average escalation of 6%. Conversely, 30% of sales in June sold under list price or took a price reduction and averaged 13 days on market and 27 days on market respectively.
 We are holding a Food Drive through the month of July, with a goal to donate $5,000 to the Volunteers of America Food Banks across Snohomish County. You can